
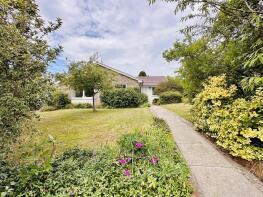
House Prices in Winscombe
House prices in Winscombe have an overall average of £455,764 over the last year.
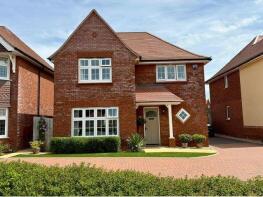
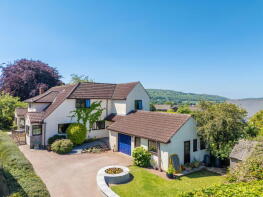
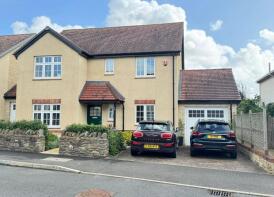
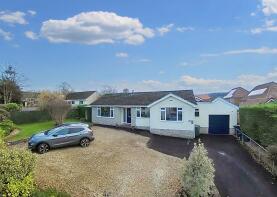
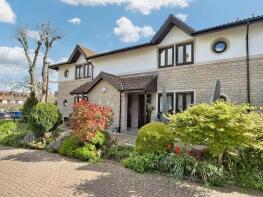
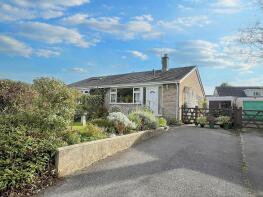
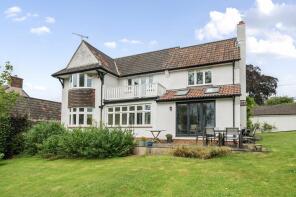
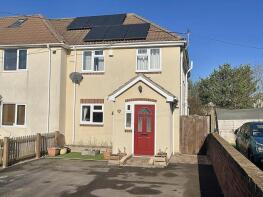
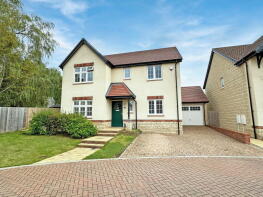
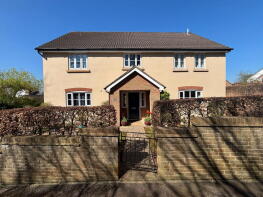
The majority of properties sold in Winscombe during the last year were detached properties, selling for an average price of £604,652. Semi-detached properties sold for an average of £291,811, with flats fetching £132,750.
Overall, the historical sold prices in Winscombe over the last year were 7% up on the previous year and similar to the 2022 peak of £458,665.
Properties Sold
48, Wimblestone Road, Winscombe BS25 1JP

| Today | See what it's worth now |
| 17 Apr 2026 | £84,100 |
| 16 Mar 2023 | £285,000 |
No other historical records.
34, Brae Road, Winscombe BS25 1LJ
| Today | See what it's worth now |
| 16 Apr 2026 | £562,000 |
| 18 Aug 2022 | £390,000 |
1, Observatory Field, Winscombe BS25 1LL
| Today | See what it's worth now |
| 9 Apr 2026 | £545,000 |
| 6 Oct 2020 | £457,500 |
7, Woodborough Drive, Winscombe BS25 1HA
| Today | See what it's worth now |
| 30 Mar 2026 | £350,000 |
| 3 Feb 2014 | £210,000 |
4, Woodborough Road, Winscombe BS25 1AA
| Today | See what it's worth now |
| 26 Mar 2026 | £277,500 |
| 27 Sep 2019 | £200,000 |
19, Wimblestone Road, Winscombe BS25 1JR

| Today | See what it's worth now |
| 13 Mar 2026 | £280,000 |
| 24 Aug 2011 | £175,000 |
9, Dexter Way, Winscombe BS25 1EF
| Today | See what it's worth now |
| 13 Mar 2026 | £545,000 |
| 3 Dec 2021 | £512,995 |
No other historical records.
Whitestones, Hillyfields, Winscombe BS25 1PH
| Today | See what it's worth now |
| 10 Feb 2026 | £863,200 |
| 23 Sep 2011 | £495,000 |
20, The Chestnuts, Winscombe BS25 1LD
| Today | See what it's worth now |
| 20 Jan 2026 | £658,000 |
| 29 Mar 2021 | £600,000 |
63c, Woodborough Road, Winscombe BS25 1BA
| Today | See what it's worth now |
| 19 Dec 2025 | £623,500 |
| 29 May 2020 | £405,500 |
90, Dexter Way, Winscombe BS25 1EF

| Today | See what it's worth now |
| 19 Dec 2025 | £357,500 |
| 30 Jun 2023 | £345,000 |
No other historical records.
Flat 38, Dunster Court, Woodborough Road, Winscombe BS25 1AG
| Today | See what it's worth now |
| 18 Dec 2025 | £165,000 |
| 10 Oct 2024 | £152,500 |
10, Small Down End, Winscombe BS25 1JT
| Today | See what it's worth now |
| 17 Dec 2025 | £262,200 |
| 25 Apr 2002 | £110,000 |
Applegarth, Oakridge Lane, Winscombe BS25 1LZ
| Today | See what it's worth now |
| 9 Dec 2025 | £765,000 |
| 29 Jan 2010 | £390,000 |
26a, Homefield Close, Winscombe BS25 1JE
| Today | See what it's worth now |
| 8 Dec 2025 | £400,000 |
No other historical records.
Caradon, Fox Lane, Winscombe BS25 1NF
| Today | See what it's worth now |
| 19 Nov 2025 | £635,000 |
| 24 Nov 2004 | £425,000 |
No other historical records.
Flat 2, Mendip Lodge, Woodborough Drive, Winscombe BS25 1HN
| Today | See what it's worth now |
| 11 Nov 2025 | £120,000 |
| 12 Nov 2014 | £95,000 |
61, Woodborough Road, Winscombe BS25 1BA
| Today | See what it's worth now |
| 11 Nov 2025 | £230,000 |
No other historical records.
25, Sidcot Lane, Winscombe BS25 1LA
| Today | See what it's worth now |
| 31 Oct 2025 | £525,000 |
| 4 Sep 2015 | £485,000 |
No other historical records.
44, The Chestnuts, Winscombe BS25 1LD
| Today | See what it's worth now |
| 24 Oct 2025 | £585,000 |
| 7 Aug 2020 | £570,000 |
No other historical records.
14, Observatory Field, Winscombe BS25 1LL
| Today | See what it's worth now |
| 24 Oct 2025 | £620,000 |
| 30 Mar 2007 | £447,500 |
8, Belmont Road, Winscombe BS25 1LE
| Today | See what it's worth now |
| 20 Oct 2025 | £370,000 |
No other historical records.
Wintrath, Bristol Road, Winscombe BS25 1PR
| Today | See what it's worth now |
| 17 Oct 2025 | £1,400,000 |
| 19 Dec 2012 | £695,000 |
Source Acknowledgement: © Crown copyright. England and Wales house price data is publicly available information produced by the HM Land Registry.This material was last updated on 9 July 2026. It covers the period from 1 January 1995 to 30 April 2026 and contains property transactions which have been registered during that period. Contains HM Land Registry data © Crown copyright and database right 2026. This data is licensed under the Open Government Licence v3.0.
Disclaimer: Rightmove.co.uk provides this HM Land Registry data "as is". The burden for fitness of the data relies completely with the user and is provided for informational purposes only. No warranty, express or implied, is given relating to the accuracy of content of the HM Land Registry data and Rightmove does not accept any liability for error or omission. If you have found an error with the data or need further information please contact HM Land Registry.
Permitted Use: Viewers of this Information are granted permission to access this Crown copyright material and to download it onto electronic, magnetic, optical or similar storage media provided that such activities are for private research, study or in-house use only. Any other use of the material requires the formal written permission of Land Registry which can be requested from us, and is subject to an additional licence and associated charge.
Rightmove takes no liability for your use of, or reliance on, Rightmove's Instant Valuation due to the limitations of our tracking tool listed here. Use of this tool is taken entirely at your own risk. All rights reserved.