
House Prices in Langford
House prices in Langford have an overall average of £419,075 over the last year.
The majority of properties sold in Langford during the last year were semi-detached properties, selling for an average price of £414,926. Detached properties sold for an average of £562,545, with terraced properties fetching £320,278.
Overall, the historical sold prices in Langford over the last year were 8% down on the previous year and 11% down on the 2022 peak of £472,897.
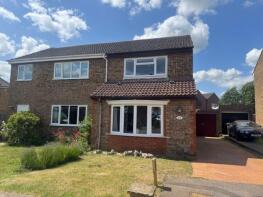
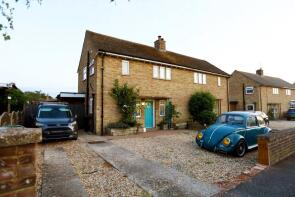
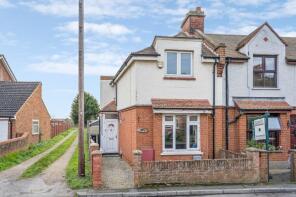
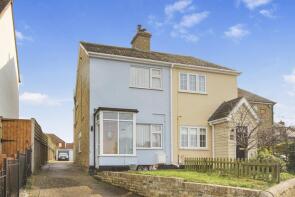
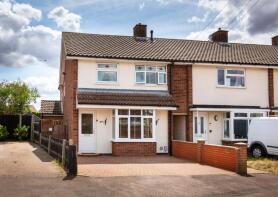
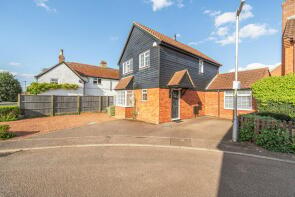
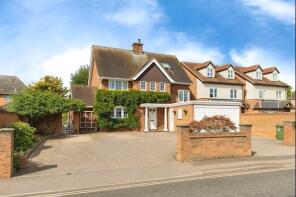
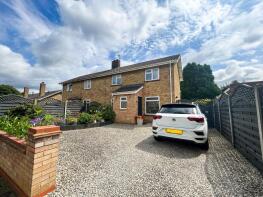
Properties Sold
10, Rivermead Court, Ivel Close, Biggleswade SG18 9RW
| Today | See what it's worth now |
| 30 Mar 2026 | £230,000 |
| 10 Jul 2018 | £210,000 |
No other historical records.
56, Church Street, Biggleswade SG18 9QR
| Today | See what it's worth now |
| 26 Mar 2026 | £485,000 |
| 4 Jan 2018 | £415,000 |
80, Station Road, Biggleswade SG18 9PQ
| Today | See what it's worth now |
| 19 Mar 2026 | £493,000 |
| 8 May 2018 | £370,000 |
No other historical records.
5, East Road, Biggleswade SG18 9QF
| Today | See what it's worth now |
| 27 Feb 2026 | £439,110 |
| 16 Dec 2020 | £385,000 |
9, Ivel Close, Biggleswade SG18 9RW

| Today | See what it's worth now |
| 20 Feb 2026 | £400,000 |
| 13 Aug 1999 | £120,000 |
No other historical records.
9, Church Street, Biggleswade SG18 9QT

| Today | See what it's worth now |
| 17 Dec 2025 | £310,000 |
| 1 Dec 2023 | £310,000 |
Rookery Nook, Langford Road, Biggleswade SG18 9RA
| Today | See what it's worth now |
| 11 Dec 2025 | £635,000 |
| 7 Feb 2014 | £330,000 |
25, Manor Close, Biggleswade SG18 9PU
| Today | See what it's worth now |
| 5 Dec 2025 | £325,000 |
| 28 Oct 2016 | £235,500 |
No other historical records.
16, Prospect Road, Biggleswade SG18 9NY
| Today | See what it's worth now |
| 28 Nov 2025 | £330,000 |
| 6 Aug 2018 | £272,000 |
No other historical records.
48, East Road, Biggleswade SG18 9QN
| Today | See what it's worth now |
| 21 Nov 2025 | £380,000 |
| 24 May 2013 | £189,950 |
149, Church Street, Biggleswade SG18 9NX
| Today | See what it's worth now |
| 21 Nov 2025 | £325,000 |
| 24 Mar 2020 | £250,000 |
No other historical records.
31, High Street, Biggleswade SG18 9RU

| Today | See what it's worth now |
| 14 Nov 2025 | £270,000 |
| 8 Nov 2017 | £228,000 |
34, Newtown, Henlow SG16 6AJ
| Today | See what it's worth now |
| 7 Nov 2025 | £480,000 |
| 21 Sep 2021 | £445,000 |
No other historical records.
28, Denny Crescent, Biggleswade SG18 9QG
| Today | See what it's worth now |
| 7 Nov 2025 | £410,000 |
| 5 Sep 1997 | £47,000 |
No other historical records.
1, Lakes Close, Biggleswade SG18 9SJ
| Today | See what it's worth now |
| 7 Nov 2025 | £477,500 |
| 4 Jun 2021 | £400,000 |
No other historical records.
66, High Street, Biggleswade SG18 9RU
| Today | See what it's worth now |
| 23 Oct 2025 | £765,000 |
| 13 Oct 2011 | £440,000 |
No other historical records.
2, Queens Way, Biggleswade SG18 9QQ
| Today | See what it's worth now |
| 17 Oct 2025 | £350,000 |
| 18 Feb 2021 | £305,000 |
5, Cambridge Gardens, Langford SG18 9SF
| Today | See what it's worth now |
| 14 Oct 2025 | £525,000 |
No other historical records.
56a Beaks Reach, High Street, Biggleswade SG18 9RU
| Today | See what it's worth now |
| 13 Oct 2025 | £917,500 |
No other historical records.
11, Manor Close, Biggleswade SG18 9PU
| Today | See what it's worth now |
| 9 Oct 2025 | £320,000 |
| 21 Apr 2011 | £177,500 |
89, Station Road, Biggleswade SG18 9PQ

| Today | See what it's worth now |
| 1 Oct 2025 | £350,000 |
| 26 Apr 2002 | £97,000 |
No other historical records.
7, Turner Gardens, Biggleswade SG18 9GD

| Today | See what it's worth now |
| 29 Sep 2025 | £445,000 |
| 9 Jul 2021 | £367,500 |
No other historical records.
11, Ivel Cottages, Langford Road, Biggleswade SG18 9QU
| Today | See what it's worth now |
| 29 Sep 2025 | £295,000 |
| 29 Sep 2015 | £215,000 |
Source Acknowledgement: © Crown copyright. England and Wales house price data is publicly available information produced by the HM Land Registry.This material was last updated on 9 July 2026. It covers the period from 1 January 1995 to 30 April 2026 and contains property transactions which have been registered during that period. Contains HM Land Registry data © Crown copyright and database right 2026. This data is licensed under the Open Government Licence v3.0.
Disclaimer: Rightmove.co.uk provides this HM Land Registry data "as is". The burden for fitness of the data relies completely with the user and is provided for informational purposes only. No warranty, express or implied, is given relating to the accuracy of content of the HM Land Registry data and Rightmove does not accept any liability for error or omission. If you have found an error with the data or need further information please contact HM Land Registry.
Permitted Use: Viewers of this Information are granted permission to access this Crown copyright material and to download it onto electronic, magnetic, optical or similar storage media provided that such activities are for private research, study or in-house use only. Any other use of the material requires the formal written permission of Land Registry which can be requested from us, and is subject to an additional licence and associated charge.
Rightmove takes no liability for your use of, or reliance on, Rightmove's Instant Valuation due to the limitations of our tracking tool listed here. Use of this tool is taken entirely at your own risk. All rights reserved.