
House Prices in Woburn Sands
House prices in Woburn Sands have an overall average of £499,892 over the last year.
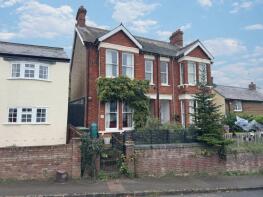
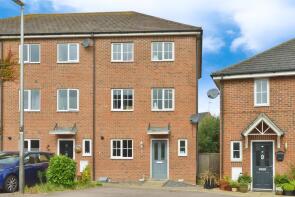
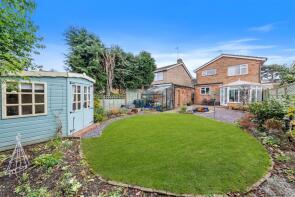
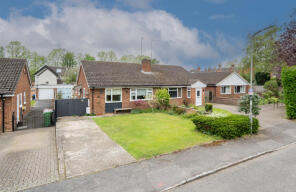
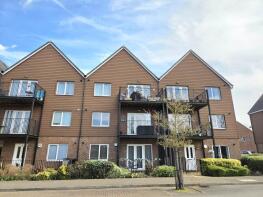
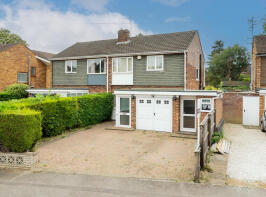
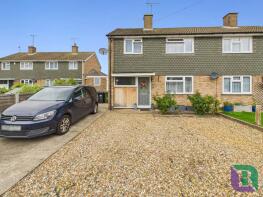
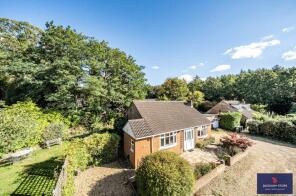
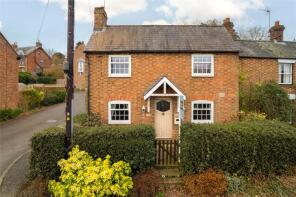
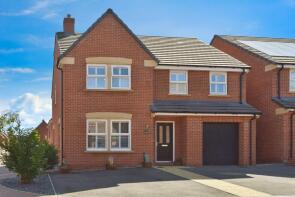
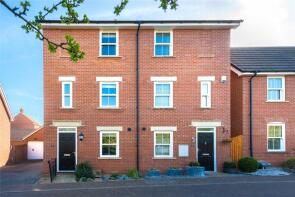
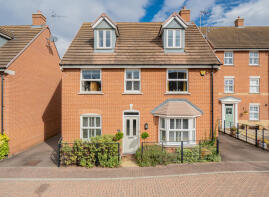
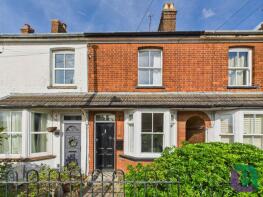
The majority of properties sold in Woburn Sands during the last year were detached properties, selling for an average price of £655,329. Semi-detached properties sold for an average of £456,262, with terraced properties fetching £386,250.
Overall, the historical sold prices in Woburn Sands over the last year were 6% up on the previous year and 8% down on the 2022 peak of £541,298.
Properties Sold
7, Greensand View, Milton Keynes MK17 8GR
| Today | See what it's worth now |
| 31 Mar 2026 | £110,000 |
| 22 Aug 2022 | £110,000 |
No other historical records.
8, Elm Grove, Milton Keynes MK17 8PS
| Today | See what it's worth now |
| 30 Mar 2026 | £365,000 |
| 4 Sep 2017 | £310,000 |
No other historical records.
133, Greensand View, Milton Keynes MK17 8GR
| Today | See what it's worth now |
| 30 Mar 2026 | £265,000 |
| 28 Mar 2008 | £217,995 |
No other historical records.
10, Kiln Drive, Milton Keynes MK17 8FE
| Today | See what it's worth now |
| 25 Mar 2026 | £590,000 |
| 21 Jun 2013 | £387,000 |
No other historical records.
30, Aspley Hill, Woburn Sands MK17 8NJ

| Today | See what it's worth now |
| 23 Mar 2026 | £660,000 |
No other historical records.
59, Greensand View, Milton Keynes MK17 8GR
| Today | See what it's worth now |
| 19 Mar 2026 | £560,000 |
| 31 Jul 2014 | £395,000 |
40, Drayhorse Crescent, Milton Keynes MK17 8GU
| Today | See what it's worth now |
| 17 Mar 2026 | £565,000 |
| 22 May 2015 | £400,000 |
No other historical records.
26, Church Road, Woburn Sands, Aspley Heath MK17 8TA
| Today | See what it's worth now |
| 3 Mar 2026 | £595,000 |
No other historical records.
7, Firemans Run, Milton Keynes MK17 8GL
| Today | See what it's worth now |
| 20 Feb 2026 | £390,000 |
| 25 Jun 2021 | £370,000 |
84, Driscoll Drive, Woburn Sands MK17 8ZP
| Today | See what it's worth now |
| 20 Feb 2026 | £665,000 |
No other historical records.
2c, Russell Street, Milton Keynes MK17 8NX
| Today | See what it's worth now |
| 20 Feb 2026 | £365,000 |
| 22 Apr 2022 | £320,000 |
75, Cranbrook, Milton Keynes MK17 8ND
| Today | See what it's worth now |
| 20 Feb 2026 | £154,000 |
| 22 Nov 2021 | £135,000 |
24, Vicarage Street, Woburn Sands MK17 8RE
| Today | See what it's worth now |
| 19 Feb 2026 | £490,000 |
No other historical records.
89, Elm Grove, Milton Keynes MK17 8QA
| Today | See what it's worth now |
| 19 Feb 2026 | £420,000 |
| 20 Aug 2019 | £295,000 |
99, Greensand View, Milton Keynes MK17 8GR
| Today | See what it's worth now |
| 18 Feb 2026 | £260,000 |
| 7 Jul 2017 | £254,000 |
32, Elm Grove, Woburn Sands MK17 8PS
| Today | See what it's worth now |
| 9 Feb 2026 | £360,000 |
No other historical records.
34, Aspley Court, Woburn Road, Milton Keynes MK17 8PA
| Today | See what it's worth now |
| 9 Feb 2026 | £138,000 |
| 1 Sep 1998 | £44,500 |
No other historical records.
39, Elm Grove, Milton Keynes MK17 8QA
| Today | See what it's worth now |
| 6 Feb 2026 | £392,500 |
| 12 Nov 2010 | £210,000 |
1, Dene Close, Milton Keynes MK17 8NL
| Today | See what it's worth now |
| 6 Feb 2026 | £495,000 |
| 13 Jul 2005 | £282,500 |
10, Hardwick Road, Milton Keynes MK17 8QJ
| Today | See what it's worth now |
| 2 Feb 2026 | £415,000 |
| 20 Nov 2020 | £362,500 |
79, Summerlin Drive, Milton Keynes MK17 8GP
| Today | See what it's worth now |
| 2 Feb 2026 | £563,000 |
| 16 Dec 2019 | £480,000 |
No other historical records.
36, Weathercock Close, Milton Keynes MK17 8SS

| Today | See what it's worth now |
| 29 Jan 2026 | £385,000 |
| 28 Jun 2019 | £290,000 |
No other historical records.
6, Kiln Drive, Milton Keynes MK17 8FE
| Today | See what it's worth now |
| 29 Jan 2026 | £435,000 |
| 5 Dec 2019 | £362,000 |
Source Acknowledgement: © Crown copyright. England and Wales house price data is publicly available information produced by the HM Land Registry.This material was last updated on 9 July 2026. It covers the period from 1 January 1995 to 30 April 2026 and contains property transactions which have been registered during that period. Contains HM Land Registry data © Crown copyright and database right 2026. This data is licensed under the Open Government Licence v3.0.
Disclaimer: Rightmove.co.uk provides this HM Land Registry data "as is". The burden for fitness of the data relies completely with the user and is provided for informational purposes only. No warranty, express or implied, is given relating to the accuracy of content of the HM Land Registry data and Rightmove does not accept any liability for error or omission. If you have found an error with the data or need further information please contact HM Land Registry.
Permitted Use: Viewers of this Information are granted permission to access this Crown copyright material and to download it onto electronic, magnetic, optical or similar storage media provided that such activities are for private research, study or in-house use only. Any other use of the material requires the formal written permission of Land Registry which can be requested from us, and is subject to an additional licence and associated charge.
Rightmove takes no liability for your use of, or reliance on, Rightmove's Instant Valuation due to the limitations of our tracking tool listed here. Use of this tool is taken entirely at your own risk. All rights reserved.