
House Prices in Wyberton
House prices in Wyberton have an overall average of £201,133 over the last year.
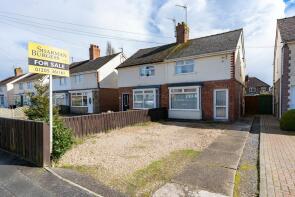
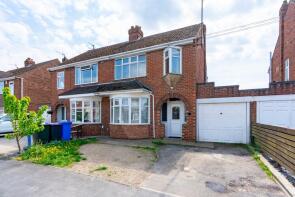
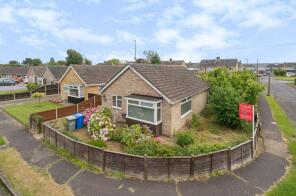
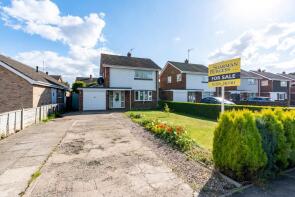
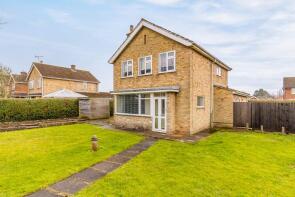
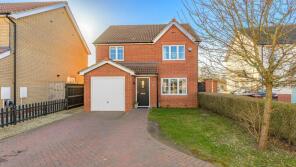
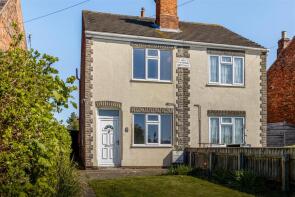
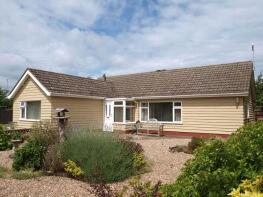
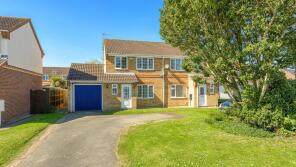
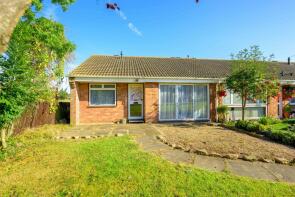
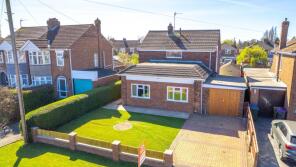
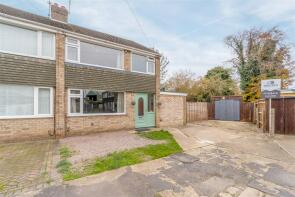
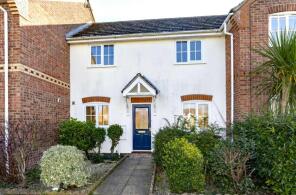
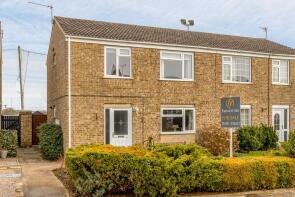
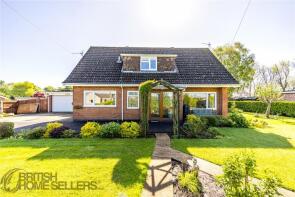
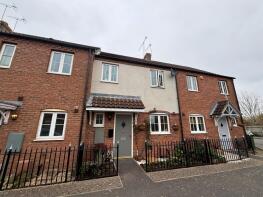
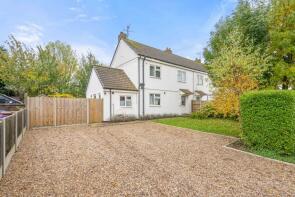
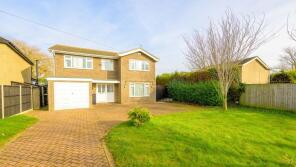
The majority of properties sold in Wyberton during the last year were detached properties, selling for an average price of £265,848. Semi-detached properties sold for an average of £162,153, with terraced properties fetching £160,945.
Overall, the historical sold prices in Wyberton over the last year were 6% down on the previous year and 8% down on the 2022 peak of £218,966.
Properties Sold
8, Granville Avenue, Wyberton, Boston PE21 7BY
| Today | See what it's worth now |
| 20 Oct 2025 | £143,000 |
| 24 Mar 2017 | £118,000 |
25, Bayswood Avenue, Boston PE21 7RT
| Today | See what it's worth now |
| 19 Sep 2025 | £169,950 |
| 27 Jan 2006 | £137,500 |
59, Woodside, Boston PE21 7HE
| Today | See what it's worth now |
| 18 Sep 2025 | £165,000 |
| 2 Nov 2015 | £135,000 |
16, Tytton Lane West, Wyberton, Boston PE21 7HL
| Today | See what it's worth now |
| 17 Sep 2025 | £245,000 |
| 12 Sep 1997 | £42,000 |
14, Gardeners Walk, Boston PE21 7LB
| Today | See what it's worth now |
| 17 Sep 2025 | £320,000 |
| 2 Jul 2001 | £109,950 |
No other historical records.
252, London Road, Wyberton, Boston PE21 7AZ
| Today | See what it's worth now |
| 15 Sep 2025 | £205,000 |
| 3 Dec 2021 | £175,000 |
No other historical records.
21, Solhem Avenue, Wyberton, Boston PE21 7DA
| Today | See what it's worth now |
| 5 Sep 2025 | £167,500 |
| 13 Dec 2002 | £84,000 |
24, Solway Avenue, Wyberton, Boston PE21 7HR
| Today | See what it's worth now |
| 4 Sep 2025 | £220,000 |
| 29 Nov 2013 | £118,000 |
259, London Road, Wyberton, Boston PE21 7BA
| Today | See what it's worth now |
| 29 Aug 2025 | £265,000 |
| 3 Apr 2013 | £141,000 |
No other historical records.
75, Sir Isaac Newton Drive, Boston PE21 7SG
| Today | See what it's worth now |
| 15 Aug 2025 | £272,500 |
| 27 Jun 2016 | £204,950 |
No other historical records.
The Old School House, Low Road, Wyberton, Boston PE21 7AS
| Today | See what it's worth now |
| 6 Aug 2025 | £290,000 |
| 19 Mar 2021 | £290,000 |
91, Wyberton West Road, Boston PE21 7JS
| Today | See what it's worth now |
| 25 Jul 2025 | £125,000 |
| 20 Jan 2017 | £88,500 |
No other historical records.
47a, Bayswood Avenue, Boston PE21 7RT
| Today | See what it's worth now |
| 24 Jul 2025 | £300,000 |
| 4 Oct 2013 | £125,000 |
141, Wyberton Low Road, Boston PE21 7RZ
| Today | See what it's worth now |
| 24 Jul 2025 | £210,000 |
| 31 May 2019 | £160,000 |
Flat D, 26, St Thomas Drive, Boston PE21 7EP


| Today | See what it's worth now |
| 17 Jul 2025 | £90,000 |
| 7 Mar 2008 | £87,000 |
No other historical records.
10, Carmel Green, Boston PE21 7JR
| Today | See what it's worth now |
| 15 Jul 2025 | £120,000 |
| 1 Aug 2014 | £112,950 |
109, Wyberton Low Road, Boston PE21 7RH
| Today | See what it's worth now |
| 20 Jun 2025 | £235,000 |
| 29 Nov 2013 | £125,000 |
No other historical records.
51, Woodside, Boston PE21 7HE
| Today | See what it's worth now |
| 13 Jun 2025 | £182,000 |
| 16 Mar 2017 | £135,000 |
17, Fleming Court, Boston PE21 7SS
| Today | See what it's worth now |
| 5 Jun 2025 | £135,000 |
| 5 Sep 2003 | £79,000 |
74, Clarke Court, Wyberton, Boston PE21 7EF
| Today | See what it's worth now |
| 22 May 2025 | £158,500 |
| 1 Jul 2005 | £117,000 |
Windrush, Low Road, Wyberton, Boston PE21 7AS
| Today | See what it's worth now |
| 21 May 2025 | £340,000 |
| 7 Feb 2017 | £257,000 |
No other historical records.
5, The Old Dairy, Boston PE21 7TB
| Today | See what it's worth now |
| 30 Apr 2025 | £148,000 |
| 3 Jan 2007 | £110,000 |
14, Solhem Avenue, Wyberton, Boston PE21 7DA
| Today | See what it's worth now |
| 28 Apr 2025 | £160,000 |
| 12 Aug 2015 | £129,000 |
25, Egret Place, Wyberton, Boston PE21 7FH

| Today | See what it's worth now |
| 28 Apr 2025 | £83,250 |
| 9 Jul 2021 | £72,000 |
No other historical records.
59, West End Road, Wyberton, Boston PE21 7LP
| Today | See what it's worth now |
| 28 Apr 2025 | £272,500 |
| 4 Dec 1998 | £84,000 |
No other historical records.
Get ready with a Mortgage in Principle
- Personalised result in just 20 minutes
- Find out how much you can borrow
- Get viewings faster with agents
- No impact on your credit score
What's your property worth?
Source Acknowledgement: © Crown copyright. England and Wales house price data is publicly available information produced by the HM Land Registry.This material was last updated on 2 December 2025. It covers the period from 1 January 1995 to 31 October 2025 and contains property transactions which have been registered during that period. Contains HM Land Registry data © Crown copyright and database right 2026. This data is licensed under the Open Government Licence v3.0.
Disclaimer: Rightmove.co.uk provides this HM Land Registry data "as is". The burden for fitness of the data relies completely with the user and is provided for informational purposes only. No warranty, express or implied, is given relating to the accuracy of content of the HM Land Registry data and Rightmove does not accept any liability for error or omission. If you have found an error with the data or need further information please contact HM Land Registry.
Permitted Use: Viewers of this Information are granted permission to access this Crown copyright material and to download it onto electronic, magnetic, optical or similar storage media provided that such activities are for private research, study or in-house use only. Any other use of the material requires the formal written permission of Land Registry which can be requested from us, and is subject to an additional licence and associated charge.
Map data ©OpenStreetMap contributors.
Rightmove takes no liability for your use of, or reliance on, Rightmove's Instant Valuation due to the limitations of our tracking tool listed here. Use of this tool is taken entirely at your own risk. All rights reserved.