
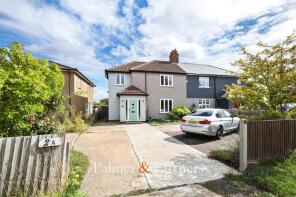
House Prices in Abberton
House prices in Abberton have an overall average of £436,143 over the last year.
The majority of properties sold in Abberton during the last year were detached properties, selling for an average price of £547,000. Semi-detached properties sold for an average of £355,000, with flats fetching £155,000.
Overall, the historical sold prices in Abberton over the last year were 19% down on the previous year and 9% down on the 2014 peak of £481,538.
Properties Sold
3, Hillcrest Cottages, Mersea Road, Colchester CO5 7NS
| Today | See what it's worth now |
| 25 Mar 2026 | £430,000 |
| 1 Nov 2013 | £180,000 |
No other historical records.
22, Abberton Grange, Layer Road, Colchester CO5 7NL
| Today | See what it's worth now |
| 3 Feb 2026 | £155,000 |
| 19 Dec 2016 | £219,995 |
5, Estuary Meadow, Peldon Road, Abberton CO5 7FF
| Today | See what it's worth now |
| 30 Jan 2026 | £600,000 |
No other historical records.
2, Meadow Way, Colchester CO5 7PH

| Today | See what it's worth now |
| 14 Jan 2026 | £280,000 |
| 28 Apr 2022 | £310,177 |
Manwood Rose, Mersea Road, Colchester CO5 7NR
| Today | See what it's worth now |
| 19 Dec 2025 | £390,000 |
| 27 Nov 1997 | £112,000 |
No other historical records.
2, Estuary Meadow, Peldon Road, Abberton CO5 7FF
| Today | See what it's worth now |
| 16 Dec 2025 | £695,000 |
No other historical records.
Hawthorn House, Peldon Road, Abberton CO5 7PB
| Today | See what it's worth now |
| 8 Dec 2025 | £503,000 |
No other historical records.
Forge Cottage, Mersea Road, Colchester CO5 7NR
| Today | See what it's worth now |
| 28 May 2025 | £490,000 |
| 12 Nov 1998 | £125,000 |
No other historical records.
Manwood Barn, Mersea Road, Colchester CO5 7NS
| Today | See what it's worth now |
| 20 May 2025 | £1,100,000 |
| 24 Mar 2016 | £845,000 |
No other historical records.
31, Peldon Road, Colchester CO5 7PB
| Today | See what it's worth now |
| 28 Mar 2025 | £280,000 |
| 27 Nov 2000 | £77,500 |
Manwood Cottage, Mersea Road, Abberton CO5 7NR

| Today | See what it's worth now |
| 3 Mar 2025 | £420,000 |
No other historical records.
14, Bracken Way, Colchester CO5 7PG
| Today | See what it's worth now |
| 17 Feb 2025 | £300,000 |
| 19 Dec 2013 | £172,500 |
Little Oak Cottage, Mersea Road, Colchester CO5 7NR
| Today | See what it's worth now |
| 31 Jan 2025 | £500,000 |
| 20 Apr 2007 | £287,000 |
4, The Paddocks, Peldon Road, Colchester CO5 7PA
| Today | See what it's worth now |
| 11 Dec 2024 | £552,500 |
| 8 Jul 2020 | £545,000 |
11, Meadow Way, Abberton CO5 7PH
| Today | See what it's worth now |
| 29 Nov 2024 | £295,000 |
No other historical records.
25, Fingringhoe Road, Colchester CO5 7LA
| Today | See what it's worth now |
| 21 Aug 2024 | £530,000 |
| 25 Sep 2014 | £323,000 |
No other historical records.
Montrose, Mersea Road, Abberton, Langenhoe CO5 7NS
| Today | See what it's worth now |
| 25 Jun 2024 | £370,000 |
No other historical records.
Abberton Hall, Layer Road, Colchester CO5 7NH

| Today | See what it's worth now |
| 19 Jun 2024 | £1,050,000 |
| 12 Sep 2014 | £1,300,000 |
Hillcroft, Mersea Road, Colchester CO5 7LE

| Today | See what it's worth now |
| 2 Feb 2024 | £585,000 |
| 10 Oct 2013 | £412,500 |
2, Hillcrest Cottages, Mersea Road, Colchester CO5 7NS

| Today | See what it's worth now |
| 3 Nov 2023 | £250,000 |
No other historical records.
2, Broom Way, Colchester CO5 7PQ
| Today | See what it's worth now |
| 28 Sep 2023 | £355,000 |
| 21 Jan 2015 | £210,000 |
No other historical records.
23, Abberton Grange, Layer Road, Colchester CO5 7NL
| Today | See what it's worth now |
| 5 Sep 2023 | £165,000 |
| 17 Dec 2009 | £158,000 |
No other historical records.
15, Abberton Grange, Layer Road, Colchester CO5 7NL

| Today | See what it's worth now |
| 4 Sep 2023 | £209,000 |
| 13 Mar 2018 | £221,500 |

Source Acknowledgement: © Crown copyright. England and Wales house price data is publicly available information produced by the HM Land Registry.This material was last updated on 9 July 2026. It covers the period from 1 January 1995 to 30 April 2026 and contains property transactions which have been registered during that period. Contains HM Land Registry data © Crown copyright and database right 2026. This data is licensed under the Open Government Licence v3.0.
Disclaimer: Rightmove.co.uk provides this HM Land Registry data "as is". The burden for fitness of the data relies completely with the user and is provided for informational purposes only. No warranty, express or implied, is given relating to the accuracy of content of the HM Land Registry data and Rightmove does not accept any liability for error or omission. If you have found an error with the data or need further information please contact HM Land Registry.
Permitted Use: Viewers of this Information are granted permission to access this Crown copyright material and to download it onto electronic, magnetic, optical or similar storage media provided that such activities are for private research, study or in-house use only. Any other use of the material requires the formal written permission of Land Registry which can be requested from us, and is subject to an additional licence and associated charge.
Rightmove takes no liability for your use of, or reliance on, Rightmove's Instant Valuation due to the limitations of our tracking tool listed here. Use of this tool is taken entirely at your own risk. All rights reserved.