
House Prices in Abbey Grange
House prices in Abbey Grange have an overall average of £245,357 over the last year.
The majority of properties sold in Abbey Grange during the last year were detached properties, selling for an average price of £359,125. Terraced properties sold for an average of £170,428, with semi-detached properties fetching £210,750.
Overall, the historical sold prices in Abbey Grange over the last year were 22% up on the previous year and 2% down on the 2022 peak of £250,845.
Properties Sold
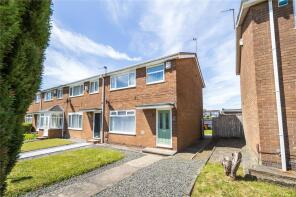
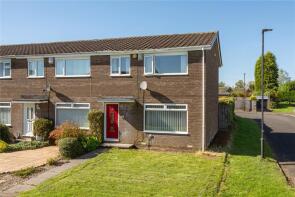
10, Knightside Walk, Chapel Park, Newcastle Upon Tyne NE5 1TN
| Today | See what it's worth now |
| 24 Oct 2025 | £174,995 |
| 3 Dec 2021 | £143,500 |
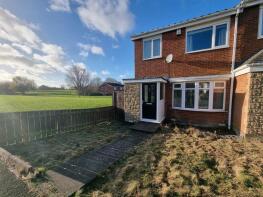
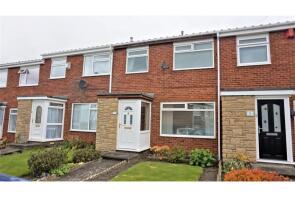
20, Lilac Close, Chapel Park, Newcastle Upon Tyne NE5 1UU
| Today | See what it's worth now |
| 15 Sep 2025 | £162,500 |
| 10 Sep 2021 | £155,000 |
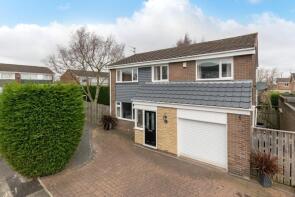
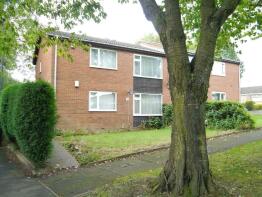
1, Kelson Way, Chapel Park, Newcastle Upon Tyne NE5 1TS
| Today | See what it's worth now |
| 18 Jul 2025 | £360,000 |
| 16 Jan 2004 | £186,000 |
No other historical records.
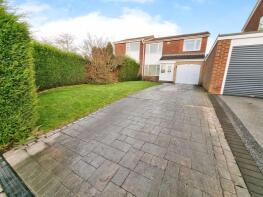
25, Lobelia Close, Chapel Park, Newcastle Upon Tyne NE5 1UT
| Today | See what it's worth now |
| 27 Jun 2025 | £233,000 |
| 18 Mar 2019 | £192,000 |
131, Chadderton Drive, West Denton, Newcastle Upon Tyne NE5 1HS
| Today | See what it's worth now |
| 20 Jun 2025 | £285,000 |
| 17 May 1996 | £57,000 |
No other historical records.
2, Jasmin Avenue, Chapel Park, Newcastle Upon Tyne NE5 1TL
| Today | See what it's worth now |
| 15 May 2025 | £283,000 |
| 24 Sep 2021 | £300,000 |
16, The Glade, North Walbottle, Newcastle Upon Tyne NE15 9XJ
| Today | See what it's worth now |
| 4 Apr 2025 | £345,000 |
| 8 Jan 2021 | £305,000 |
15, Juniper Walk, Chapel Park, Newcastle Upon Tyne NE5 1UE
| Today | See what it's worth now |
| 4 Apr 2025 | £180,000 |
| 19 Dec 2008 | £130,000 |
No other historical records.
39, North Walbottle Road, North Walbottle, Newcastle Upon Tyne NE5 1XD
| Today | See what it's worth now |
| 28 Mar 2025 | £175,500 |
| 3 Nov 2020 | £145,000 |
12, Coley Hill Close, Chapel Park, Newcastle Upon Tyne NE5 1UZ
| Today | See what it's worth now |
| 28 Mar 2025 | £330,000 |
| 18 Sep 2020 | £292,500 |
106, Ladybank, North Walbottle, Newcastle Upon Tyne NE5 1UP
| Today | See what it's worth now |
| 28 Mar 2025 | £170,000 |
| 5 Sep 2002 | £89,950 |
No other historical records.
38, Knightside Walk, Chapel Park, Newcastle Upon Tyne NE5 1TP
| Today | See what it's worth now |
| 28 Mar 2025 | £135,000 |
| 21 May 2021 | £85,000 |
12, Ashford Grove, Chapel Park, Newcastle Upon Tyne NE5 1QS
| Today | See what it's worth now |
| 21 Mar 2025 | £385,000 |
No other historical records.
7, Ingram Drive, Chapel Park, Newcastle Upon Tyne NE5 1TG
| Today | See what it's worth now |
| 11 Mar 2025 | £420,000 |
| 2 Feb 2007 | £255,000 |
No other historical records.
9, Mangrove Close, North Walbottle, Newcastle Upon Tyne NE5 1YA
| Today | See what it's worth now |
| 11 Mar 2025 | £320,000 |
| 16 Mar 2006 | £280,000 |
No other historical records.
25, Kidderminster Drive, Chapel Park, Newcastle Upon Tyne NE5 1TZ
| Today | See what it's worth now |
| 7 Mar 2025 | £190,000 |
| 11 Jul 2014 | £140,000 |
No other historical records.
2, Aylsham Close, North Walbottle, Newcastle Upon Tyne NE5 1QT


| Today | See what it's worth now |
| 20 Feb 2025 | £430,000 |
| 1 Aug 1997 | £130,000 |
No other historical records.
31, Juniper Walk, Chapel Park, Newcastle Upon Tyne NE5 1UG
| Today | See what it's worth now |
| 13 Feb 2025 | £177,000 |
| 7 Jun 2006 | £141,500 |
2, Lilac Close, Chapel Park, Newcastle Upon Tyne NE5 1UU
| Today | See what it's worth now |
| 6 Feb 2025 | £153,000 |
| 12 Oct 2018 | £135,000 |
No other historical records.
50, Knightside Walk, Chapel Park, Newcastle Upon Tyne NE5 1TP

| Today | See what it's worth now |
| 31 Jan 2025 | £128,000 |
| 27 Nov 2018 | £107,000 |
43, Lotus Close, West Denton, Newcastle Upon Tyne NE5 1XB
| Today | See what it's worth now |
| 17 Jan 2025 | £115,500 |
| 22 Jun 2018 | £104,000 |
No other historical records.
13, Nedderton Close, North Walbottle, Newcastle Upon Tyne NE5 1QF
| Today | See what it's worth now |
| 6 Dec 2024 | £219,950 |
| 2 Sep 2022 | £199,950 |
39, Jedburgh Close, Chapel Park, Newcastle Upon Tyne NE5 1TH
| Today | See what it's worth now |
| 5 Dec 2024 | £305,000 |
No other historical records.
7, Kidderminster Drive, Chapel Park, Newcastle Upon Tyne NE5 1TZ
| Today | See what it's worth now |
| 22 Nov 2024 | £220,000 |
No other historical records.
10, Lotus Close, Chapel Park, Newcastle Upon Tyne NE5 1XB
| Today | See what it's worth now |
| 28 Oct 2024 | £145,000 |
No other historical records.
Get ready with a Mortgage in Principle
- Personalised result in just 20 minutes
- Find out how much you can borrow
- Get viewings faster with agents
- No impact on your credit score
What's your property worth?
Source Acknowledgement: © Crown copyright. England and Wales house price data is publicly available information produced by the HM Land Registry.This material was last updated on 2 December 2025. It covers the period from 1 January 1995 to 31 October 2025 and contains property transactions which have been registered during that period. Contains HM Land Registry data © Crown copyright and database right 2026. This data is licensed under the Open Government Licence v3.0.
Disclaimer: Rightmove.co.uk provides this HM Land Registry data "as is". The burden for fitness of the data relies completely with the user and is provided for informational purposes only. No warranty, express or implied, is given relating to the accuracy of content of the HM Land Registry data and Rightmove does not accept any liability for error or omission. If you have found an error with the data or need further information please contact HM Land Registry.
Permitted Use: Viewers of this Information are granted permission to access this Crown copyright material and to download it onto electronic, magnetic, optical or similar storage media provided that such activities are for private research, study or in-house use only. Any other use of the material requires the formal written permission of Land Registry which can be requested from us, and is subject to an additional licence and associated charge.
Map data ©OpenStreetMap contributors.
Rightmove takes no liability for your use of, or reliance on, Rightmove's Instant Valuation due to the limitations of our tracking tool listed here. Use of this tool is taken entirely at your own risk. All rights reserved.