
House Prices in Acklington
House prices in Acklington have an overall average of £429,200 over the last year.
The majority of properties sold in Acklington during the last year were detached properties, selling for an average price of £517,500. Terraced properties sold for an average of £400,500, with semi-detached properties fetching £310,000.
Overall, the historical sold prices in Acklington over the last year were 3% up on the previous year and 1% down on the 2022 peak of £435,644.
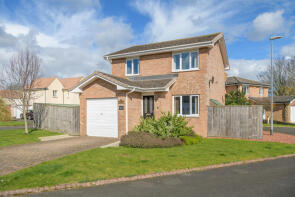
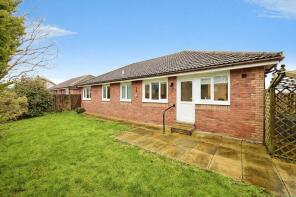
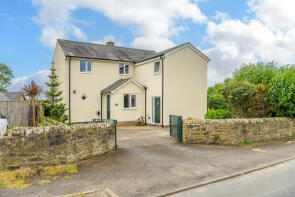
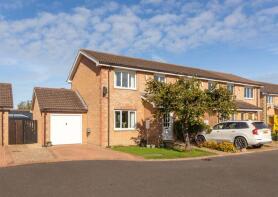
Properties Sold
Butterchurn, Cavil Head Farm, Cavil Head Road, Morpeth NE65 9DF
| Today | See what it's worth now |
| 26 Mar 2026 | £457,500 |
| 9 Sep 2016 | £338,000 |
No other historical records.
41, The Village, Morpeth NE65 9BL
| Today | See what it's worth now |
| 27 Jan 2026 | £600,000 |
| 11 Dec 2020 | £326,000 |
No other historical records.
17, Paddock View, Acklington NE65 9FR
| Today | See what it's worth now |
| 27 Jan 2026 | £435,000 |
| 19 Dec 2023 | £420,000 |
No other historical records.
46, The Village, Morpeth NE65 9BW
| Today | See what it's worth now |
| 10 Sep 2025 | £310,000 |
| 9 Dec 2014 | £203,000 |
No other historical records.
9 The Courtings, Bank House Farm, Morpeth NE65 9AP
| Today | See what it's worth now |
| 30 Jul 2025 | £343,500 |
| 7 Jul 2021 | £295,000 |
Foxglove Cottage, Cavil Head Farm, Cavil Head Road, Morpeth NE65 9DF
| Today | See what it's worth now |
| 16 Jun 2025 | £860,000 |
| 29 Jul 2019 | £680,000 |
No other historical records.
1, Southfields, Morpeth NE65 9FJ
| Today | See what it's worth now |
| 28 May 2025 | £275,000 |
| 18 Feb 2022 | £240,000 |
No other historical records.
4, Bank House Farm, Morpeth NE65 9AP

| Today | See what it's worth now |
| 20 May 2025 | £340,000 |
| 30 Jun 2004 | £210,000 |
Shunting House, Acklington NE65 9BT

| Today | See what it's worth now |
| 31 Mar 2025 | £450,000 |
| 28 Sep 2018 | £410,000 |
19, Paddock View, Acklington NE65 9FR
| Today | See what it's worth now |
| 28 Mar 2025 | £420,000 |
No other historical records.
16, Paddock View, Acklington NE65 9FR
| Today | See what it's worth now |
| 3 Mar 2025 | £480,000 |
No other historical records.
15, Paddock View, Acklington NE65 9FR
| Today | See what it's worth now |
| 9 Dec 2024 | £455,000 |
No other historical records.
7, Paddock View, Morpeth NE65 9FR

| Today | See what it's worth now |
| 5 Dec 2024 | £437,500 |
| 5 Oct 2022 | £395,000 |
No other historical records.
26, Field House Close, Morpeth NE65 9PE
| Today | See what it's worth now |
| 25 Nov 2024 | £268,000 |
| 14 Feb 2014 | £125,000 |
9, Field House Close, Morpeth NE65 9PE
| Today | See what it's worth now |
| 1 Nov 2024 | £287,500 |
| 13 Mar 2015 | £180,000 |
51 The Police House, The Village, Morpeth NE65 9BN
| Today | See what it's worth now |
| 31 Oct 2024 | £392,500 |
| 12 Nov 2014 | £160,000 |
9, Paddock View, Morpeth NE65 9FR

| Today | See what it's worth now |
| 23 Oct 2024 | £470,000 |
| 7 Oct 2022 | £395,000 |
No other historical records.
6, Field House Close, Morpeth NE65 9PE
| Today | See what it's worth now |
| 26 Jul 2024 | £148,000 |
| 2 Jul 2018 | £120,000 |
11, The Village, Morpeth NE65 9BJ
| Today | See what it's worth now |
| 16 Jul 2024 | £300,000 |
No other historical records.
8, Bank House Farm, Morpeth NE65 9AP

| Today | See what it's worth now |
| 4 Jul 2024 | £184,000 |
| 22 Oct 1999 | £53,000 |
No other historical records.
Mill House, C100 Guyzance Mill, Morpeth NE65 9AF

| Today | See what it's worth now |
| 24 Jun 2024 | £1,005,000 |
No other historical records.
1, Bank House Cottages, Acklington NE65 9AN
| Today | See what it's worth now |
| 14 Jun 2024 | £325,000 |
No other historical records.
4, Guyzance Village, Morpeth NE65 9AQ
| Today | See what it's worth now |
| 29 May 2024 | £535,000 |
| 1 Dec 2005 | £310,000 |

Source Acknowledgement: © Crown copyright. England and Wales house price data is publicly available information produced by the HM Land Registry.This material was last updated on 9 July 2026. It covers the period from 1 January 1995 to 30 April 2026 and contains property transactions which have been registered during that period. Contains HM Land Registry data © Crown copyright and database right 2026. This data is licensed under the Open Government Licence v3.0.
Disclaimer: Rightmove.co.uk provides this HM Land Registry data "as is". The burden for fitness of the data relies completely with the user and is provided for informational purposes only. No warranty, express or implied, is given relating to the accuracy of content of the HM Land Registry data and Rightmove does not accept any liability for error or omission. If you have found an error with the data or need further information please contact HM Land Registry.
Permitted Use: Viewers of this Information are granted permission to access this Crown copyright material and to download it onto electronic, magnetic, optical or similar storage media provided that such activities are for private research, study or in-house use only. Any other use of the material requires the formal written permission of Land Registry which can be requested from us, and is subject to an additional licence and associated charge.
Rightmove takes no liability for your use of, or reliance on, Rightmove's Instant Valuation due to the limitations of our tracking tool listed here. Use of this tool is taken entirely at your own risk. All rights reserved.