
House Prices in Alconbury
House prices in Alconbury have an overall average of £364,986 over the last year.
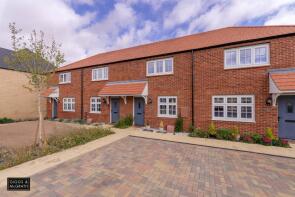
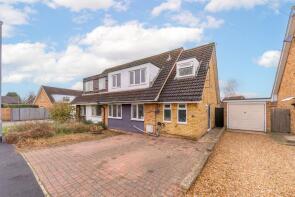
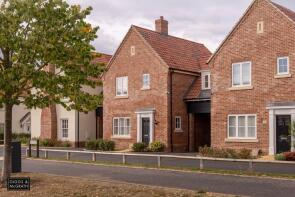
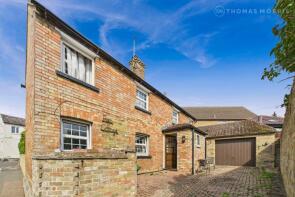
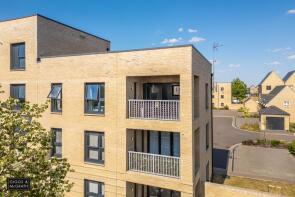
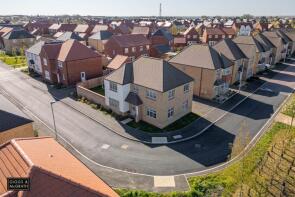
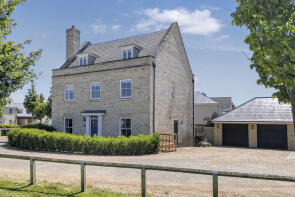
The majority of properties sold in Alconbury during the last year were detached properties, selling for an average price of £432,559. Semi-detached properties sold for an average of £312,167, with terraced properties fetching £293,714.
Overall, the historical sold prices in Alconbury over the last year were 13% down on the previous year and 7% down on the 2023 peak of £392,567.
Properties Sold
82, Senliz Road, Huntingdon PE28 4FR
| Today | See what it's worth now |
| 21 Apr 2026 | £350,000 |
| 28 Jan 2022 | £325,000 |
16, Garnatte Drive, Huntingdon PE28 4GH

| Today | See what it's worth now |
| 16 Apr 2026 | £362,000 |
| 27 Nov 2020 | £349,750 |
No other historical records.
12, School Lane, Huntingdon PE28 4EQ
| Today | See what it's worth now |
| 14 Apr 2026 | £290,000 |
| 8 Sep 2010 | £110,000 |
No other historical records.
3, Ford End, Huntingdon PE28 4HD
| Today | See what it's worth now |
| 20 Mar 2026 | £315,000 |
| 12 Oct 2018 | £299,995 |
50, Carnaile Road, Huntingdon PE28 4XP
| Today | See what it's worth now |
| 13 Mar 2026 | £360,000 |
| 9 Apr 2021 | £318,750 |
No other historical records.
14, Wren Close, Huntingdon PE28 4WG

| Today | See what it's worth now |
| 12 Mar 2026 | £255,000 |
| 25 Mar 2011 | £130,000 |
21, Druell Way, Alconbury Weald PE28 4NU
| Today | See what it's worth now |
| 6 Mar 2026 | £265,000 |
| 22 Nov 2023 | £264,950 |
No other historical records.
46, Manor Lane, Huntingdon PE28 4EH
| Today | See what it's worth now |
| 27 Feb 2026 | £325,000 |
| 31 Mar 2021 | £280,000 |
Kiln Barn, The Maltings, Huntingdon PE28 4DZ
| Today | See what it's worth now |
| 24 Feb 2026 | £662,500 |
| 26 Feb 2018 | £500,000 |
43, Senliz Road, Alconbury Weald PE28 4LY
| Today | See what it's worth now |
| 18 Feb 2026 | £369,000 |
| 22 Sep 2023 | £365,000 |
No other historical records.
22, Coulson Way, Huntingdon PE28 4WU

| Today | See what it's worth now |
| 30 Jan 2026 | £355,000 |
| 18 Oct 1999 | £130,000 |
No other historical records.
3, High Street, Huntingdon PE28 4DS
| Today | See what it's worth now |
| 28 Jan 2026 | £280,000 |
| 12 Apr 2001 | £121,500 |
No other historical records.
15, Cartwright Close, Huntingdon PE28 4LX
| Today | See what it's worth now |
| 19 Jan 2026 | £225,000 |
| 25 Feb 2022 | £225,000 |
No other historical records.
18, Druell Way, Alconbury Weald PE28 4NU
| Today | See what it's worth now |
| 14 Jan 2026 | £465,000 |
| 23 Jun 2023 | £493,950 |
No other historical records.
15, Sayer Drive, Huntingdon PE28 4LS
| Today | See what it's worth now |
| 19 Dec 2025 | £108,000 |
No other historical records.
14, Radmyle Apartments, Rawlyns Way, Alconbury Weald PE28 4HW

| Today | See what it's worth now |
| 19 Dec 2025 | £242,000 |
| 3 Dec 2020 | £242,250 |
No other historical records.
8, Pinner Lane, Huntingdon PE28 4XT
| Today | See what it's worth now |
| 15 Dec 2025 | £640,000 |
| 11 May 2018 | £529,995 |
No other historical records.
6, Hillfield, Huntingdon PE28 4WA
| Today | See what it's worth now |
| 5 Dec 2025 | £330,000 |
| 3 Sep 2020 | £268,000 |
15, Trice Way, Alconbury Weald PE28 4DH
| Today | See what it's worth now |
| 3 Dec 2025 | £365,000 |
| 1 Nov 2024 | £349,750 |
No other historical records.
61, Wassingley Way, Huntingdon PE28 4LT
| Today | See what it's worth now |
| 28 Nov 2025 | £280,000 |
| 16 Oct 2020 | £264,950 |
No other historical records.
3, Veasey Way, Huntingdon PE28 4GJ
| Today | See what it's worth now |
| 21 Nov 2025 | £350,000 |
| 26 Feb 2021 | £329,750 |
No other historical records.
15, Bardolph Way, Huntingdon PE28 4BP
| Today | See what it's worth now |
| 7 Nov 2025 | £492,500 |
| 20 Apr 2021 | £437,950 |
23, Pople Drive, Huntingdon PE28 4XU
| Today | See what it's worth now |
| 31 Oct 2025 | £406,500 |
| 13 Jul 2018 | £349,995 |
No other historical records.
Source Acknowledgement: © Crown copyright. England and Wales house price data is publicly available information produced by the HM Land Registry.This material was last updated on 9 July 2026. It covers the period from 1 January 1995 to 30 April 2026 and contains property transactions which have been registered during that period. Contains HM Land Registry data © Crown copyright and database right 2026. This data is licensed under the Open Government Licence v3.0.
Disclaimer: Rightmove.co.uk provides this HM Land Registry data "as is". The burden for fitness of the data relies completely with the user and is provided for informational purposes only. No warranty, express or implied, is given relating to the accuracy of content of the HM Land Registry data and Rightmove does not accept any liability for error or omission. If you have found an error with the data or need further information please contact HM Land Registry.
Permitted Use: Viewers of this Information are granted permission to access this Crown copyright material and to download it onto electronic, magnetic, optical or similar storage media provided that such activities are for private research, study or in-house use only. Any other use of the material requires the formal written permission of Land Registry which can be requested from us, and is subject to an additional licence and associated charge.
Rightmove takes no liability for your use of, or reliance on, Rightmove's Instant Valuation due to the limitations of our tracking tool listed here. Use of this tool is taken entirely at your own risk. All rights reserved.