
House Prices in Aldochlay
House prices in Aldochlay have an overall average of £182,310 over the last year.
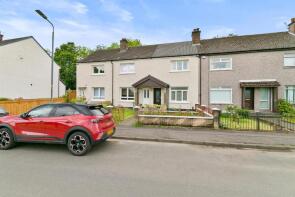
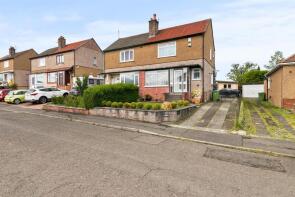
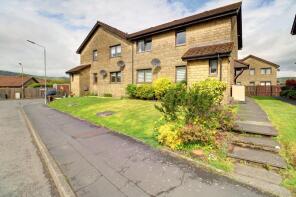
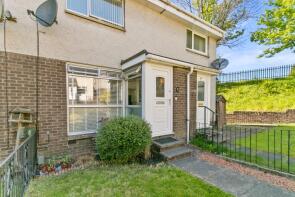
The majority of properties sold in Aldochlay during the last year were flats, selling for an average price of £128,496. Semi-detached properties sold for an average of £195,935, with terraced properties fetching £155,832.
Overall, the historical sold prices in Aldochlay over the last year were 4% down on the previous year and 9% down on the 2021 peak of £199,618.
Properties Sold
3, Mclean Crescent, Balloch G83 8HW
| Today | See what it's worth now |
| 30 Oct 2025 | £230,000 |
No other historical records.
27, Smith Crescent, Balloch G83 8BL
| Today | See what it's worth now |
| 29 Oct 2025 | £85,000 |
No other historical records.
7, Shandon Brae, Alexandria G83 8ET
| Today | See what it's worth now |
| 28 Oct 2025 | £165,000 |
| 14 Dec 2011 | £48,000 |
No other historical records.
13, Steele Crescent, Alexandria G83 8AP
| Today | See what it's worth now |
| 23 Oct 2025 | £152,000 |
| 21 May 2019 | £78,000 |
Flat G/2, 1, Kessog Gardens, Balloch G83 8QJ
| Today | See what it's worth now |
| 21 Oct 2025 | £142,222 |
| 15 Feb 2022 | £112,000 |
12, Shandon Brae, Balloch, Alexandria G83 8ES
| Today | See what it's worth now |
| 20 Oct 2025 | £125,000 |
No other historical records.
Flat 1, 7, Mcintyre Terrace, Alexandria G83 8PU
| Today | See what it's worth now |
| 20 Oct 2025 | £80,000 |
| 10 Mar 2009 | £64,000 |
6, Castle Avenue, Balloch G83 8JX


| Today | See what it's worth now |
| 20 Oct 2025 | £115,200 |
No other historical records.
34, Inchconnachan Avenue, Alexandria G83 8JN
| Today | See what it's worth now |
| 17 Oct 2025 | £282,150 |
| 1 Jul 2019 | £120,000 |
No other historical records.
Woodvale, Drymen Road, Alexandria G83 8HT
| Today | See what it's worth now |
| 14 Oct 2025 | £490,000 |
| 17 Aug 2018 | £440,000 |
Flat 1, 18, Carson Road, Alexandria G83 8QG
| Today | See what it's worth now |
| 13 Oct 2025 | £180,000 |
| 28 Aug 2024 | £80,000 |
30, Ledrish Avenue, Balloch G83 8JB
| Today | See what it's worth now |
| 26 Sep 2025 | £303,000 |
No other historical records.
Flat 0/2, 13, Carrochan Gardens, Balloch, Alexandria G83 8FF

| Today | See what it's worth now |
| 25 Sep 2025 | £260,000 |
No other historical records.
2, Mcintyre Terrace, Balloch G83 8PU

| Today | See what it's worth now |
| 24 Sep 2025 | £130,000 |
No other historical records.
37, Park Avenue, Alexandria G83 8JR
| Today | See what it's worth now |
| 22 Sep 2025 | £232,000 |
| 17 Dec 2021 | £222,502 |
No other historical records.
Flat 1, 13, Tullichewan Drive, Alexandria G83 0JN
| Today | See what it's worth now |
| 16 Sep 2025 | £73,513 |
| 8 Nov 2007 | £69,000 |
20, Bramblehedge Path, Jamestown, Alexandria G83 8PH
| Today | See what it's worth now |
| 16 Sep 2025 | £240,000 |
| 25 Jan 2005 | £160,000 |
10, Old Luss Road, Balloch G83 8QP
| Today | See what it's worth now |
| 9 Sep 2025 | £160,000 |
No other historical records.
12, Castle Avenue, Balloch G83 8HX
| Today | See what it's worth now |
| 2 Sep 2025 | £225,150 |
No other historical records.
28, Woodburn Avenue, Alexandria G83 8AS
| Today | See what it's worth now |
| 1 Sep 2025 | £145,250 |
| 8 Dec 2020 | £86,000 |
No other historical records.
24, Endrick Drive, Balloch G83 8HY
| Today | See what it's worth now |
| 1 Sep 2025 | £250,044 |
| 12 Sep 2024 | £200,050 |
No other historical records.
8, Honeysuckle Lane, Jamestown, Alexandria G83 8PJ
| Today | See what it's worth now |
| 29 Aug 2025 | £120,000 |
| 8 Nov 2022 | £119,250 |
11, Red Fox Drive, Alexandria G83 8LP
| Today | See what it's worth now |
| 28 Aug 2025 | £145,000 |
| 9 May 2016 | £100,000 |
No other historical records.
30, Craiglynn Gardens, Balloch G83 8BX

| Today | See what it's worth now |
| 15 Aug 2025 | £100,000 |
No other historical records.
22, Tullichewan Drive, Alexandria G83 0JN
| Today | See what it's worth now |
| 15 Aug 2025 | £155,000 |
No other historical records.
Get ready with a Mortgage in Principle
- Personalised result in just 20 minutes
- Find out how much you can borrow
- Get viewings faster with agents
- No impact on your credit score
What's your property worth?
Source Acknowledgement: © Crown copyright. Scottish house price data is publicly available information produced by the Registers of Scotland. Material has been reproduced with the permission of the Keeper of the Registers of Scotland and contains data compiled by Registers of Scotland. For further information, please contact data@ros.gov.uk. Please note the dates shown here relate to the property's registered date not sold date.This material was last updated on 2 December 2025. It covers the period from 8 December 1987 to 31 October 2025 and contains property transactions which have been registered during that period.
Disclaimer: Rightmove.co.uk provides this Registers of Scotland data "as is". The burden for fitness of the data relies completely with the user and is provided for informational purposes only. No warranty, express or implied, is given relating to the accuracy of content of the Registers of Scotland data and Rightmove plc does not accept any liability for error or omission. If you have found an error with the data or need further information please contact data@ros.gov.uk
Permitted Use: The Registers of Scotland allows the reproduction of the data which it provides to Rightmove.co.uk free of charge in any format or medium only for research, private study or for internal circulation within an organisation. This is subject to it being reproduced accurately and not used in a misleading context. The material must be acknowledged as Crown Copyright. You are not allowed to use this information for commercial purposes, nor must you copy, distribute, sell or publish the data in any way. For any other use of this material, please apply to the Registers of Scotland for a licence. You can do this online at www.ros.gov.uk, by email at data@ros.gov.uk or by writing to Business Development, Registers of Scotland, Meadowbank House, 153 London Road, Edinburgh EH8 7AU.
Map data ©OpenStreetMap contributors.
Rightmove takes no liability for your use of, or reliance on, Rightmove's Instant Valuation due to the limitations of our tracking tool listed here. Use of this tool is taken entirely at your own risk. All rights reserved.