
House Prices in Apley
House prices in Apley have an overall average of £336,342 over the last year.
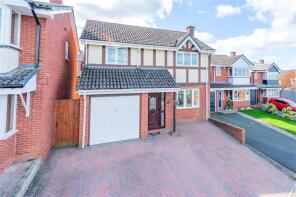
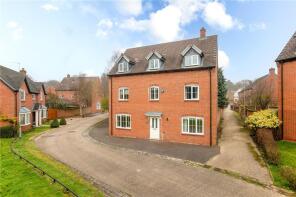
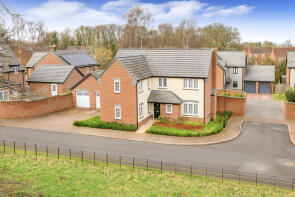
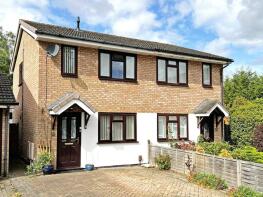
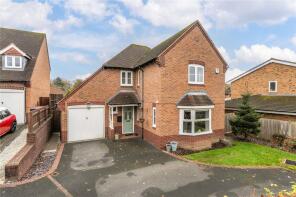
The majority of properties sold in Apley during the last year were detached properties, selling for an average price of £366,109. Semi-detached properties sold for an average of £167,667.
Overall, the historical sold prices in Apley over the last year were 1% up on the previous year and similar to the 2021 peak of £334,090.
Properties Sold
27, Redwing Close, Apley, Telford TF1 6FX
| Today | See what it's worth now |
| 10 Apr 2026 | £305,000 |
| 19 Dec 2019 | £222,500 |
41, Shoveller Drive, Apley, Telford TF1 6GQ
| Today | See what it's worth now |
| 25 Mar 2026 | £410,000 |
| 24 Mar 2005 | £316,950 |
No other historical records.
3, Brambling Close, Apley, Telford TF1 6AP
| Today | See what it's worth now |
| 20 Feb 2026 | £555,000 |
| 23 Aug 2019 | £439,995 |
No other historical records.
5, Saxon Court, Apley, Telford TF1 6YN
| Today | See what it's worth now |
| 16 Feb 2026 | £190,000 |
| 25 Nov 2015 | £123,000 |
12, Sunderland Drive, Apley, Telford TF1 6XX
| Today | See what it's worth now |
| 12 Jan 2026 | £280,000 |
| 25 Jun 2020 | £178,000 |
2, Cavell Close, Apley, Telford TF1 6DB
| Today | See what it's worth now |
| 19 Dec 2025 | £320,000 |
| 17 Jul 2001 | £97,500 |
24, Nuthatch Crescent, Apley, Telford TF1 6AQ
| Today | See what it's worth now |
| 19 Dec 2025 | £382,500 |
| 11 Dec 2020 | £342,000 |
No other historical records.
9, Shellduck Drive, Apley, Telford TF1 6GA
| Today | See what it's worth now |
| 19 Dec 2025 | £400,000 |
| 31 May 2002 | £172,000 |
47, Kingfisher Way, Apley, Telford TF1 6FW
| Today | See what it's worth now |
| 17 Dec 2025 | £267,500 |
No other historical records.
12, Barnes Wallis Drive, Apley, Telford TF1 6XT
| Today | See what it's worth now |
| 10 Dec 2025 | £160,000 |
| 6 Feb 2015 | £157,000 |
9, Manchester Drive, Apley, Telford TF1 6XY
| Today | See what it's worth now |
| 9 Dec 2025 | £270,000 |
| 28 Sep 2018 | £184,000 |
24, Elder Avenue, Apley, Telford TF1 6BG
| Today | See what it's worth now |
| 1 Dec 2025 | £395,000 |
| 30 Jun 2023 | £404,995 |
No other historical records.
10, Nuthatch Crescent, Apley, Telford TF1 6AQ

| Today | See what it's worth now |
| 7 Nov 2025 | £88,000 |
No other historical records.
3, Raven Meadow, Apley, Telford TF1 6AW
| Today | See what it's worth now |
| 22 Oct 2025 | £225,000 |
| 1 Apr 2021 | £193,000 |
No other historical records.
22, Peregrine Way, Apley, Telford TF1 6TH

| Today | See what it's worth now |
| 25 Sep 2025 | £633,000 |
| 12 Feb 2013 | £330,000 |
No other historical records.
2, Shellduck Drive, Apley, Telford TF1 6GA
| Today | See what it's worth now |
| 25 Jul 2025 | £383,000 |
| 25 Sep 1998 | £100,000 |
No other historical records.
20, Shellduck Drive, Apley, Telford TF1 6GA
| Today | See what it's worth now |
| 25 Jul 2025 | £310,000 |
| 31 May 2002 | £128,995 |
5, Lily Lane, Apley, Telford TF1 6BE
| Today | See what it's worth now |
| 18 Jul 2025 | £349,950 |
No other historical records.
11, Tulip Grove, Apley, Telford TF1 6BA
| Today | See what it's worth now |
| 14 Jul 2025 | £429,950 |
No other historical records.
6, Tulip Grove, Apley, Telford TF1 6BA
| Today | See what it's worth now |
| 11 Jul 2025 | £372,950 |
No other historical records.
18, Amaryllis Drive, Apley, Telford TF1 6AZ
| Today | See what it's worth now |
| 20 Jun 2025 | £349,950 |
No other historical records.
26, Sparrowhawk Way, Apley, Telford TF1 6NH
| Today | See what it's worth now |
| 19 Jun 2025 | £575,000 |
| 17 Dec 1998 | £148,500 |
No other historical records.
59, Shoveller Drive, Apley, Telford TF1 6GQ
| Today | See what it's worth now |
| 5 Jun 2025 | £512,000 |
| 1 Sep 2005 | £269,950 |
No other historical records.
Source Acknowledgement: © Crown copyright. England and Wales house price data is publicly available information produced by the HM Land Registry.This material was last updated on 9 July 2026. It covers the period from 1 January 1995 to 30 April 2026 and contains property transactions which have been registered during that period. Contains HM Land Registry data © Crown copyright and database right 2026. This data is licensed under the Open Government Licence v3.0.
Disclaimer: Rightmove.co.uk provides this HM Land Registry data "as is". The burden for fitness of the data relies completely with the user and is provided for informational purposes only. No warranty, express or implied, is given relating to the accuracy of content of the HM Land Registry data and Rightmove does not accept any liability for error or omission. If you have found an error with the data or need further information please contact HM Land Registry.
Permitted Use: Viewers of this Information are granted permission to access this Crown copyright material and to download it onto electronic, magnetic, optical or similar storage media provided that such activities are for private research, study or in-house use only. Any other use of the material requires the formal written permission of Land Registry which can be requested from us, and is subject to an additional licence and associated charge.
Rightmove takes no liability for your use of, or reliance on, Rightmove's Instant Valuation due to the limitations of our tracking tool listed here. Use of this tool is taken entirely at your own risk. All rights reserved.