
House Prices in Apperley Bridge
House prices in Apperley Bridge have an overall average of £307,052 over the last year.
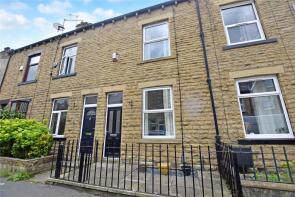
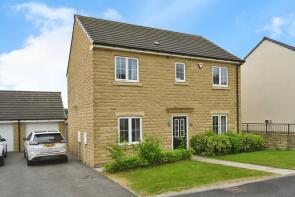
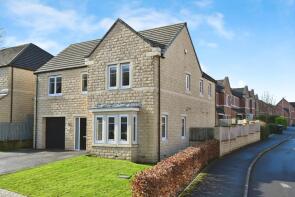
The majority of properties sold in Apperley Bridge during the last year were terraced properties, selling for an average price of £231,851. Detached properties sold for an average of £489,608, with semi-detached properties fetching £286,115.
Overall, the historical sold prices in Apperley Bridge over the last year were 4% up on the previous year and 8% up on the 2019 peak of £285,410.
Properties Sold
8, Ashgrove, Greengates, Bradford BD10 0BP
| Today | See what it's worth now |
| 8 Apr 2026 | £180,000 |
| 20 Oct 2006 | £138,500 |
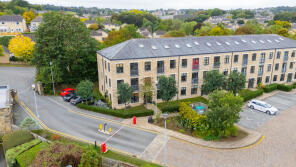
Apartment 1, Tenterfields House, Meadow Road, Apperley Bridge, Bradford BD10 0LQ
| Today | See what it's worth now |
| 8 Apr 2026 | £160,000 |
| 26 Jun 2023 | £152,000 |
2, Oaklea, Apperley Bridge, Bradford BD10 0EJ
| Today | See what it's worth now |
| 1 Apr 2026 | £400,000 |
| 27 Sep 2018 | £337,495 |
No other historical records.
28, Providence Avenue, Apperley Bridge, Bradford BD10 0TQ
| Today | See what it's worth now |
| 1 Apr 2026 | £510,000 |
| 28 Jul 2016 | £392,950 |
No other historical records.
83, New Line, Bradford BD10 9AP
| Today | See what it's worth now |
| 19 Mar 2026 | £247,000 |
| 10 Dec 1999 | £55,950 |
6, Church Close, Apperley Bridge, Bradford BD10 0FG
| Today | See what it's worth now |
| 13 Mar 2026 | £499,950 |
| 21 Sep 2020 | £414,950 |
No other historical records.
17, West Wood View, Apperley Bridge, Bradford BD10 0FJ
| Today | See what it's worth now |
| 17 Feb 2026 | £490,000 |
| 6 Dec 2019 | £419,950 |
No other historical records.
159, New Line, Bradford BD10 0BN
| Today | See what it's worth now |
| 12 Feb 2026 | £171,000 |
| 22 Mar 2024 | £86,000 |
2, Apperley Gardens, Apperley Bridge, Bradford BD10 0ND
| Today | See what it's worth now |
| 30 Jan 2026 | £205,000 |
| 31 Aug 2011 | £10,000 |
24, Simpson Grove, Apperley Bridge, Bradford BD10 9SD
| Today | See what it's worth now |
| 30 Jan 2026 | £225,000 |
| 5 Feb 2021 | £215,000 |
15, West Wood View, Apperley Bridge, Bradford BD10 0FJ
| Today | See what it's worth now |
| 28 Jan 2026 | £385,000 |
| 25 Jun 2021 | £370,000 |
44, Carr Bottom Road, Greengates, Bradford BD10 0BB
| Today | See what it's worth now |
| 28 Jan 2026 | £236,000 |
| 8 May 2019 | £202,500 |
Woodlands View, Apperley Lane, Rawdon, Bradford BD10 0PH
| Today | See what it's worth now |
| 23 Jan 2026 | £675,000 |
| 3 Dec 2021 | £750,000 |
3, Slingsby Close, Apperley Bridge, Bradford BD10 0UJ
| Today | See what it's worth now |
| 23 Jan 2026 | £282,500 |
| 8 Nov 2014 | £215,000 |
3, Long Preston Chase, Apperley Bridge, Bradford BD10 0UP
| Today | See what it's worth now |
| 8 Jan 2026 | £410,000 |
| 10 Nov 2006 | £277,500 |
9, Overland Crescent, Apperley Bridge, Bradford BD10 9TG
| Today | See what it's worth now |
| 8 Jan 2026 | £410,000 |
| 4 Apr 2014 | £282,000 |
50, Canal Close, Apperley Bridge, Bradford BD10 0FN
| Today | See what it's worth now |
| 19 Dec 2025 | £380,000 |
| 5 Feb 2019 | £344,995 |
No other historical records.
12, Apperley Gardens, Apperley Bridge, Bradford BD10 0ND
| Today | See what it's worth now |
| 18 Dec 2025 | £215,000 |
| 24 May 2024 | £172,000 |
No other historical records.
35, Simpson Grove, Apperley Bridge, Bradford BD10 9SD
| Today | See what it's worth now |
| 9 Dec 2025 | £329,950 |
| 18 Nov 2022 | £295,000 |
25, Navigation Drive, Apperley Bridge, Bradford BD10 0LW
| Today | See what it's worth now |
| 5 Dec 2025 | £310,000 |
| 16 Jan 2018 | £231,000 |
9, Slingsby Close, Apperley Bridge, Bradford BD10 0UJ
| Today | See what it's worth now |
| 1 Dec 2025 | £272,500 |
| 17 Dec 1999 | £73,500 |
No other historical records.
99, Brompton Drive, Apperley Bridge, Bradford BD10 0DW
| Today | See what it's worth now |
| 1 Dec 2025 | £427,500 |
| 30 Apr 2019 | £378,950 |
No other historical records.
115, Brompton Drive, Apperley Bridge, Bradford BD10 0DW
| Today | See what it's worth now |
| 28 Nov 2025 | £290,000 |
| 9 Sep 2022 | £264,995 |
No other historical records.
Source Acknowledgement: © Crown copyright. England and Wales house price data is publicly available information produced by the HM Land Registry.This material was last updated on 9 July 2026. It covers the period from 1 January 1995 to 30 April 2026 and contains property transactions which have been registered during that period. Contains HM Land Registry data © Crown copyright and database right 2026. This data is licensed under the Open Government Licence v3.0.
Disclaimer: Rightmove.co.uk provides this HM Land Registry data "as is". The burden for fitness of the data relies completely with the user and is provided for informational purposes only. No warranty, express or implied, is given relating to the accuracy of content of the HM Land Registry data and Rightmove does not accept any liability for error or omission. If you have found an error with the data or need further information please contact HM Land Registry.
Permitted Use: Viewers of this Information are granted permission to access this Crown copyright material and to download it onto electronic, magnetic, optical or similar storage media provided that such activities are for private research, study or in-house use only. Any other use of the material requires the formal written permission of Land Registry which can be requested from us, and is subject to an additional licence and associated charge.
Rightmove takes no liability for your use of, or reliance on, Rightmove's Instant Valuation due to the limitations of our tracking tool listed here. Use of this tool is taken entirely at your own risk. All rights reserved.