
House Prices in Ardvey
House prices in Ardvey have an overall average of £189,444 over the last year.
The majority of properties sold in Ardvey during the last year were detached properties, selling for an average price of £204,167. Semi-detached properties sold for an average of £120,000, with flats fetching £90,000.
Overall, the historical sold prices in Ardvey over the last year were 3% up on the previous year and similar to the 2022 peak of £190,073.
Properties Sold
5, Urgha, Isle Of Harris HS3 3BW
| Today | See today's value |
| 4 Aug 2026 | £250,000 |
| 22 Oct 2013 | £115,000 |
No other historical records.
Tamh, Kendibig, South Harris HS3 3DZ
| Today | See today's value |
| 30 Jun 2026 | £180,000 |
No other historical records.
5, Taobh Na Mara, Tarbert, Isle Of Harris HS3 3DJ
| Today | See today's value |
| 14 May 2026 | £90,000 |
| 11 Oct 2017 | £65,000 |
10, Scott Road, Tarbert HS3 3DL
| Today | See today's value |
| 28 Apr 2026 | £120,000 |
No other historical records.
3, Beacravik, Beckrivig HS3 3EX

| Today | See today's value |
| 23 Apr 2026 | £230,000 |
No other historical records.
4 Corran, Luskentyre, Isle Of Harris HS3 3HL
| Today | See today's value |
| 31 Mar 2026 | £270,000 |
| 2 Nov 2017 | £301,713 |
No other historical records.
2, Borve, Borve Harris HS3 3HT
| Today | See today's value |
| 22 Oct 2025 | £215,000 |
No other historical records.
5, Grosebay HS3 3EF
| Today | See today's value |
| 20 Oct 2025 | £225,000 |
| 22 Aug 2016 | £180,000 |
No other historical records.
7, Grosebay HS3 3EF
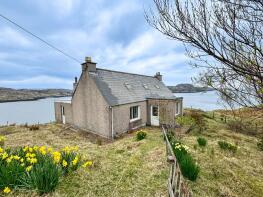
| Today | See today's value |
| 13 Oct 2025 | £125,000 |
No other historical records.
Soay Cottage, West Tarbert, Isle Of Harris HS3 3BG
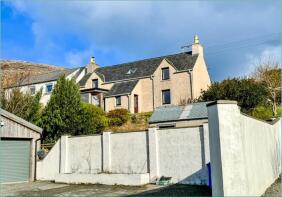
| Today | See today's value |
| 14 Aug 2025 | £235,000 |
| 15 Sep 2022 | £222,000 |
Leachin House, Leachkin HS3 3AH
| Today | See today's value |
| 7 Aug 2025 | £270,000 |
| 13 Sep 2016 | £60,000 |
No other historical records.
12 The Croft House, Geocrab, Isle Of Harris HS3 3HB
| Today | See today's value |
| 4 Aug 2025 | £177,000 |
| 27 May 2021 | £45,000 |
Tigh Gorm, East Tarbert, Isle Of Harris HS3 3DJ
| Today | See today's value |
| 14 Jul 2025 | £145,500 |
| 7 Jan 2020 | £120,000 |
No other historical records.
21, Macqueen Street, Isle Of Harris HS3 3DH
| Today | See today's value |
| 16 May 2025 | £80,000 |
| 7 Oct 2013 | £76,000 |
1, Kyles Stockinish, Stockinish HS3 3EN
| Today | See today's value |
| 14 May 2025 | £90,000 |
No other historical records.
Gearraidh Buidhe, Carriegreich, Carrigreich HS3 3BP

| Today | See today's value |
| 21 Mar 2025 | £65,000 |
No other historical records.
Tarasaigh House, Seilebost HS3 3HP
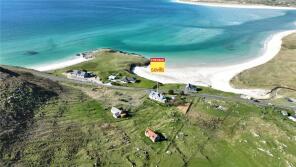
| Today | See today's value |
| 13 Mar 2025 | £550,000 |
| 13 Mar 2025 | £150,000 |
No other historical records.
2, Old Pier Road, Isle Of Harris HS3 3BQ
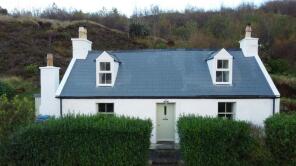
| Today | See today's value |
| 7 Mar 2025 | £190,000 |
| 1 Nov 2021 | £165,000 |
No other historical records.
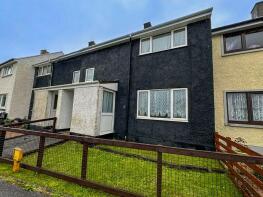
7, Macqueen Street, Tarbert HS3 3DH
| Today | See today's value |
| 3 Feb 2025 | £80,000 |
No other historical records.
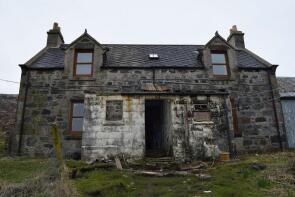
10, West Tarbert, Isle Of Harris HS3 3BG
| Today | See today's value |
| 17 Jan 2025 | £117,000 |
| 29 Aug 2023 | £60,000 |
Isay, Ardhasaig, Isle Of Harris HS3 3AJ
| Today | See today's value |
| 19 Nov 2024 | £87,500 |
| 2 Oct 2014 | £85,000 |
Loch House, Plockropool, Isle Of Harris HS3 3EB
| Today | See today's value |
| 13 Nov 2024 | £170,000 |
| 30 Jul 2008 | £199,000 |
No other historical records.
Balranald, West Tarbert, Tarbert HS3 3BG
| Today | See today's value |
| 2 Oct 2024 | £270,000 |
No other historical records.
Rightmove takes no liability for your use of, or reliance on, Rightmove's Instant Valuation due to the limitations of our tracking tool listed here. Use of this tool is taken entirely at your own risk. All rights reserved.