
House Prices in Ascott-Under-Wychwood
House prices in Ascott-Under-Wychwood have an overall average of £818,143 over the last year.
The majority of properties sold in Ascott-Under-Wychwood during the last year were detached properties, selling for an average price of £900,000. Semi-detached properties sold for an average of £613,500.
Overall, the historical sold prices in Ascott-Under-Wychwood over the last year were similar to the previous year and 59% down on the 2021 peak of £1,992,179.
Properties Sold
8 Spring Barn, High Street, Chipping Norton OX7 6AW
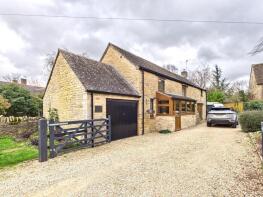
| Today | See today's value |
| 3 Aug 2026 | £980,000 |
| 13 May 2019 | £740,000 |
3, Meadowbank Close, Chipping Norton OX7 6EQ

| Today | See today's value |
| 21 Jul 2026 | £517,000 |
| 11 Jan 2019 | £395,000 |
No other historical records.
18b Maple House, Shipton Road, Chipping Norton OX7 6AF

| Today | See today's value |
| 5 Jun 2026 | £860,000 |
| 6 Jul 2007 | £520,000 |
11, London Lane, Chipping Norton OX7 6AN

| Today | See today's value |
| 6 May 2026 | £1,180,000 |
| 1 Mar 2019 | £460,000 |
No other historical records.
The Paddocks, High Street, Ascott-under-wychwood, Ascott Under Wychwood OX7 6AW

| Today | See today's value |
| 20 Feb 2026 | £710,000 |
No other historical records.
49 Appletree Cottage, Shipton Road, Chipping Norton OX7 6AG

| Today | See today's value |
| 31 Oct 2025 | £1,000,000 |
| 14 Sep 2022 | £1,000,000 |
New House, High Street, Ascott-under-wychwood, Ascott Under Wychwood OX7 6AW

| Today | See today's value |
| 24 Oct 2025 | £480,000 |
| 12 Jan 2024 | £1,150,000 |
11, Church View, Chipping Norton OX7 6AA

| Today | See today's value |
| 22 Sep 2025 | £460,000 |
| 27 Feb 1998 | £106,500 |
No other historical records.
15, London Lane, Chipping Norton OX7 6AN

| Today | See today's value |
| 12 Sep 2025 | £899,995 |
| 29 Apr 1998 | £220,000 |
No other historical records.
6, Cook Row, High Street, Chipping Norton OX7 6FY

| Today | See today's value |
| 22 Aug 2025 | £500,000 |
| 6 Sep 2006 | £286,000 |
10, Cook Row, High Street, Chipping Norton OX7 6FY

| Today | See today's value |
| 19 Mar 2025 | £325,000 |
| 5 Nov 2012 | £170,000 |
No other historical records.
4, Foresters Court, London Lane, Chipping Norton OX7 6FD

| Today | See today's value |
| 14 Feb 2025 | £1,450,000 |
| 27 Jan 2023 | £1,300,000 |
No other historical records.
35, High Street, Chipping Norton OX7 6AW

| Today | See today's value |
| 17 Jan 2025 | £1,650,000 |
| 2 Apr 1998 | £165,000 |
No other historical records.
19 Trevan, London Lane, Chipping Norton OX7 6AN

| Today | See today's value |
| 6 Jan 2025 | £670,000 |
| 29 Jun 2021 | £586,000 |
18, High Street, Chipping Norton OX7 6AW

| Today | See today's value |
| 6 Nov 2024 | £615,000 |
| 8 Dec 2006 | £400,000 |
No other historical records.
1, Station Place, Shipton Road, Ascott-under-wychwood, Ascott Under Wychwood OX7 6FZ

| Today | See today's value |
| 6 Sep 2024 | £725,000 |
No other historical records.
22 The Priory House, High Street, Chipping Norton OX7 6AW

| Today | See today's value |
| 3 Jul 2024 | £1,775,000 |
| 10 Oct 2016 | £950,000 |
No other historical records.
Flails Barn, High Street, Ascott-under-wychwood, Ascott Under Wychwood OX7 6AW

| Today | See today's value |
| 1 Mar 2024 | £813,000 |
| 26 Jul 1996 | £165,000 |
No other historical records.
18, Shipton Road, Chipping Norton OX7 6AF

| Today | See today's value |
| 1 Mar 2024 | £1,200,000 |
| 25 Jun 2010 | £650,000 |
14, Shipton Road, Chipping Norton OX7 6AF

| Today | See today's value |
| 24 Nov 2023 | £640,000 |
| 11 Mar 2010 | £241,500 |
No other historical records.
53 Willow House, Shipton Road, Chipping Norton OX7 6AG

| Today | See today's value |
| 24 Aug 2023 | £1,315,001 |
| 10 Sep 2020 | £845,000 |
34, Shipton Road, Chipping Norton OX7 6AG

| Today | See today's value |
| 26 Jun 2023 | £500,000 |
No other historical records.
5, Shipton Road, Chipping Norton OX7 6AF

| Today | See today's value |
| 15 May 2023 | £745,000 |
No other historical records.
Rightmove takes no liability for your use of, or reliance on, Rightmove's Instant Valuation due to the limitations of our tracking tool listed here. Use of this tool is taken entirely at your own risk. All rights reserved.