
House Prices in Baildon
House prices in Baildon have an overall average of £301,232 over the last year.
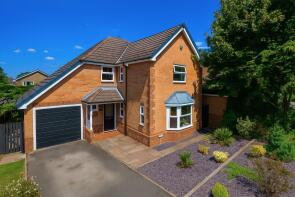
The majority of properties sold in Baildon during the last year were semi-detached properties, selling for an average price of £286,931. Detached properties sold for an average of £469,708, with terraced properties fetching £209,792.
Overall, the historical sold prices in Baildon over the last year were similar to the previous year and 6% up on the 2022 peak of £284,693.
Properties Sold
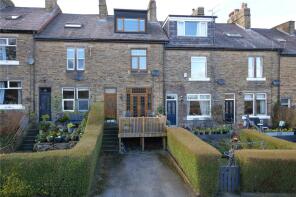
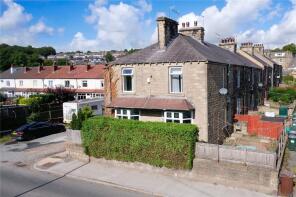
9, Westfield Terrace, Shipley BD17 5EY
| Today | See what it's worth now |
| 20 Apr 2026 | £293,000 |
| 25 Mar 2022 | £290,000 |
12, Highmoor Walk, Shipley BD17 5TT
| Today | See what it's worth now |
| 2 Apr 2026 | £464,000 |
| 13 Sep 2019 | £327,000 |
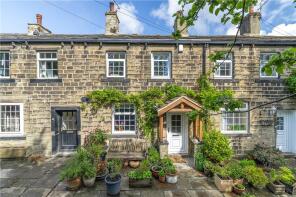
11, Providence Row, Shipley BD17 6LA
| Today | See what it's worth now |
| 1 Apr 2026 | £215,000 |
| 28 Aug 2015 | £160,000 |
24, Woodcot Avenue, Shipley BD17 6AN
| Today | See what it's worth now |
| 31 Mar 2026 | £247,500 |
| 18 Dec 2023 | £200,000 |
57, Southcliffe Drive, Baildon BD17 5QX
| Today | See what it's worth now |
| 31 Mar 2026 | £151,000 |
No other historical records.
61, Cliffe Lane South, Shipley BD17 5LB
| Today | See what it's worth now |
| 30 Mar 2026 | £195,000 |
| 8 Apr 2022 | £160,000 |
13, West Lane, Shipley BD17 5AG
| Today | See what it's worth now |
| 27 Mar 2026 | £687,500 |
| 22 Jan 2009 | £460,000 |
No other historical records.
75, Nether Hall Road, Shipley BD17 6QQ
| Today | See what it's worth now |
| 25 Mar 2026 | £320,000 |
| 24 Jan 2024 | £294,000 |
No other historical records.
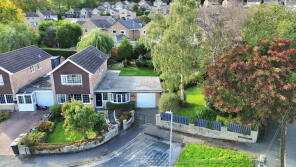
4, Gill Beck Close, Shipley BD17 6TJ

| Today | See what it's worth now |
| 24 Mar 2026 | £379,950 |
| 11 Aug 2003 | £192,000 |
No other historical records.
2a, Bankfield Terrace, Shipley BD17 7HZ
| Today | See what it's worth now |
| 20 Mar 2026 | £191,500 |
| 28 Jun 2019 | £153,000 |
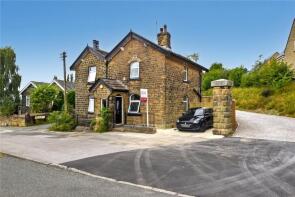
Reservoir House, West Lane, Shipley BD17 5DL
| Today | See what it's worth now |
| 20 Mar 2026 | £380,000 |
| 16 Apr 2008 | £170,000 |
No other historical records.
10, South View Terrace, Baildon BD17 5HF
| Today | See what it's worth now |
| 19 Mar 2026 | £147,000 |
No other historical records.
47, Wensleydale Rise, Shipley BD17 6TA
| Today | See what it's worth now |
| 17 Mar 2026 | £372,500 |
| 13 Dec 1996 | £90,000 |
No other historical records.
2, Valley View, Baildon BD17 5QU
| Today | See what it's worth now |
| 17 Mar 2026 | £152,250 |
No other historical records.
32, Low Fold, Shipley BD17 6LD
| Today | See what it's worth now |
| 9 Mar 2026 | £375,000 |
| 19 Feb 2021 | £319,200 |
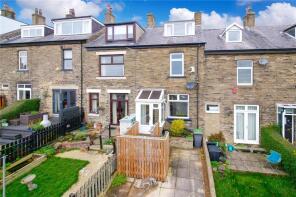
1, Westfield Terrace, Shipley BD17 5EY
| Today | See what it's worth now |
| 6 Mar 2026 | £395,000 |
| 7 Oct 2011 | £242,000 |
No other historical records.
1, Newbury Close, Shipley BD17 6PA
| Today | See what it's worth now |
| 6 Mar 2026 | £395,000 |
| 3 Dec 2012 | £247,500 |
2b, Collier Lane, Shipley BD17 5LN
| Today | See what it's worth now |
| 6 Mar 2026 | £475,000 |
| 5 Jul 2013 | £325,000 |
No other historical records.
54, Southcliffe Drive, Shipley BD17 5QX
| Today | See what it's worth now |
| 2 Mar 2026 | £219,950 |
| 28 Nov 2022 | £187,500 |
56, Hoyle Court Road, Shipley BD17 6JP
| Today | See what it's worth now |
| 27 Feb 2026 | £436,500 |
| 27 Nov 2015 | £282,500 |
No other historical records.
41, Bowland Avenue, Shipley BD17 5SA
| Today | See what it's worth now |
| 27 Feb 2026 | £185,000 |
| 14 Dec 2022 | £159,950 |
33a, Lucy Hall Drive, Shipley BD17 5BH
| Today | See what it's worth now |
| 27 Feb 2026 | £450,000 |
| 3 Feb 2022 | £280,000 |
No other historical records.
8, Cornwall Crescent, Shipley BD17 5LR
| Today | See what it's worth now |
| 27 Feb 2026 | £280,000 |
| 2 Jun 2021 | £240,000 |
No other historical records.
Source Acknowledgement: © Crown copyright. England and Wales house price data is publicly available information produced by the HM Land Registry.This material was last updated on 9 July 2026. It covers the period from 1 January 1995 to 30 April 2026 and contains property transactions which have been registered during that period. Contains HM Land Registry data © Crown copyright and database right 2026. This data is licensed under the Open Government Licence v3.0.
Disclaimer: Rightmove.co.uk provides this HM Land Registry data "as is". The burden for fitness of the data relies completely with the user and is provided for informational purposes only. No warranty, express or implied, is given relating to the accuracy of content of the HM Land Registry data and Rightmove does not accept any liability for error or omission. If you have found an error with the data or need further information please contact HM Land Registry.
Permitted Use: Viewers of this Information are granted permission to access this Crown copyright material and to download it onto electronic, magnetic, optical or similar storage media provided that such activities are for private research, study or in-house use only. Any other use of the material requires the formal written permission of Land Registry which can be requested from us, and is subject to an additional licence and associated charge.
Rightmove takes no liability for your use of, or reliance on, Rightmove's Instant Valuation due to the limitations of our tracking tool listed here. Use of this tool is taken entirely at your own risk. All rights reserved.