
House Prices in Bardney
House prices in Bardney have an overall average of £219,789 over the last year.
The majority of properties sold in Bardney during the last year were detached properties, selling for an average price of £293,750. Terraced properties sold for an average of £125,586, with semi-detached properties fetching £181,250.
Overall, the historical sold prices in Bardney over the last year were 5% down on the previous year and 11% down on the 2023 peak of £246,715.
Properties Sold
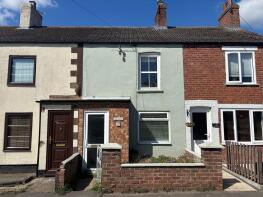
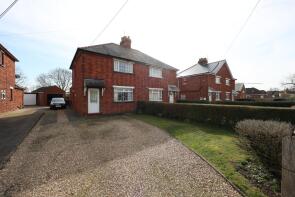
26, Silver Street, Bardney, Lincoln LN3 5SS
| Today | See what it's worth now |
| 16 Apr 2026 | £210,000 |
| 9 May 2003 | £118,000 |
10, Crowder Close, Bardney, Lincoln LN3 5SL
| Today | See what it's worth now |
| 31 Mar 2026 | £42,000 |
| 5 Mar 2024 | £37,500 |
No other historical records.
12 Jasmine Cottage, Station Road, Bardney, Lincoln LN3 5UA
| Today | See what it's worth now |
| 23 Mar 2026 | £207,000 |
| 25 Feb 2005 | £130,000 |
3, Wragby Road, Bardney, Lincoln LN3 5XE
| Today | See what it's worth now |
| 25 Feb 2026 | £215,000 |
| 17 Apr 2003 | £114,000 |
No other historical records.
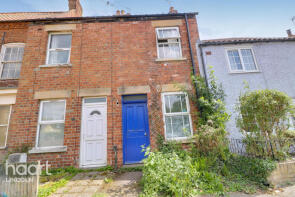
25, Silver Street, Bardney, Lincoln LN3 5SS
| Today | See what it's worth now |
| 30 Jan 2026 | £86,600 |
| 27 Feb 2009 | £50,000 |
No other historical records.
5, Thomas Kitching Way, Bardney, Lincoln LN3 5SB
| Today | See what it's worth now |
| 23 Jan 2026 | £145,000 |
| 3 Jul 2015 | £106,000 |
60, Silver Street, Bardney, Lincoln LN3 5XG

| Today | See what it's worth now |
| 23 Jan 2026 | £173,500 |
| 24 Jul 2017 | £116,000 |
10, Horncastle Road, Bardney, Lincoln LN3 5SU
| Today | See what it's worth now |
| 10 Dec 2025 | £170,000 |
| 13 Jan 2005 | £159,950 |
No other historical records.
10, Silver Street, Bardney, Lincoln LN3 5SS
| Today | See what it's worth now |
| 14 Nov 2025 | £60,000 |
| 26 Nov 2009 | £57,500 |
No other historical records.
22, David Todd Way, Bardney, Lincoln LN3 5DN
| Today | See what it's worth now |
| 7 Nov 2025 | £287,500 |
| 23 Feb 2022 | £290,000 |
84, Station Road, Bardney, Lincoln LN3 5UD
| Today | See what it's worth now |
| 30 Sep 2025 | £168,500 |
No other historical records.
1, Norman Way, Bardney, Lincoln LN3 5BT
| Today | See what it's worth now |
| 29 Sep 2025 | £140,000 |
| 28 Aug 2020 | £180,000 |
8, St Oswalds, Manor Close, Bardney, Lincoln LN3 5ST
| Today | See what it's worth now |
| 26 Sep 2025 | £190,000 |
No other historical records.
2, St Lawrence Drive, Bardney, Lincoln LN3 5SD

| Today | See what it's worth now |
| 26 Sep 2025 | £340,000 |
| 5 Apr 2022 | £316,000 |
50, Hancock Drive, Bardney, Lincoln LN3 5SR
| Today | See what it's worth now |
| 2 Sep 2025 | £140,000 |
| 28 Sep 2012 | £104,950 |
No other historical records.
43, David Todd Way, Bardney, Lincoln LN3 5DN
| Today | See what it's worth now |
| 22 Aug 2025 | £425,000 |
| 29 May 2020 | £359,950 |
No other historical records.
Brunehill Cottage, Station Road, Bardney, Lincoln LN3 5UD
| Today | See what it's worth now |
| 22 Aug 2025 | £403,750 |
No other historical records.
31, Lea Grove, Bardney, Lincoln LN3 5XN
| Today | See what it's worth now |
| 22 Aug 2025 | £250,000 |
| 30 Sep 2005 | £130,000 |
No other historical records.
75 Sycamore House, Abbey Road, Bardney, Lincoln LN3 5XD
| Today | See what it's worth now |
| 5 Aug 2025 | £594,000 |
| 18 Mar 2021 | £522,000 |
No other historical records.
23, St Lawrence Drive, Bardney, Lincoln LN3 5SD
| Today | See what it's worth now |
| 30 Jul 2025 | £175,000 |
| 27 Jul 2016 | £130,000 |
1, Lancaster Close, Bardney, Lincoln LN3 5BX
| Today | See what it's worth now |
| 22 Jul 2025 | £217,500 |
| 23 Aug 2013 | £169,000 |
No other historical records.
15, Wragby Road, Bardney, Lincoln LN3 5XR
| Today | See what it's worth now |
| 11 Jul 2025 | £195,000 |
| 1 Aug 2000 | £54,000 |
No other historical records.
25, Hancock Drive, Bardney, Lincoln LN3 5SR
| Today | See what it's worth now |
| 30 Jun 2025 | £185,000 |
| 8 Sep 2014 | £131,500 |
No other historical records.
Source Acknowledgement: © Crown copyright. England and Wales house price data is publicly available information produced by the HM Land Registry.This material was last updated on 9 July 2026. It covers the period from 1 January 1995 to 30 April 2026 and contains property transactions which have been registered during that period. Contains HM Land Registry data © Crown copyright and database right 2026. This data is licensed under the Open Government Licence v3.0.
Disclaimer: Rightmove.co.uk provides this HM Land Registry data "as is". The burden for fitness of the data relies completely with the user and is provided for informational purposes only. No warranty, express or implied, is given relating to the accuracy of content of the HM Land Registry data and Rightmove does not accept any liability for error or omission. If you have found an error with the data or need further information please contact HM Land Registry.
Permitted Use: Viewers of this Information are granted permission to access this Crown copyright material and to download it onto electronic, magnetic, optical or similar storage media provided that such activities are for private research, study or in-house use only. Any other use of the material requires the formal written permission of Land Registry which can be requested from us, and is subject to an additional licence and associated charge.
Rightmove takes no liability for your use of, or reliance on, Rightmove's Instant Valuation due to the limitations of our tracking tool listed here. Use of this tool is taken entirely at your own risk. All rights reserved.