
House Prices in Barkham
House prices in Barkham have an overall average of £632,140 over the last year.
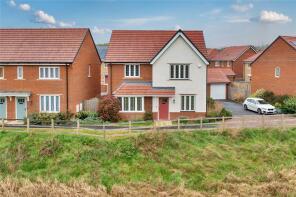
The majority of properties sold in Barkham during the last year were detached properties, selling for an average price of £704,634. Flats sold for an average of £253,875, with semi-detached properties fetching £615,000.
Overall, the historical sold prices in Barkham over the last year were 2% down on the previous year and 14% down on the 2021 peak of £731,379.
Properties Sold
8, The Junipers, Wokingham RG41 4UX
| Today | See what it's worth now |
| 24 Apr 2026 | £595,000 |
| 20 Mar 2025 | £547,500 |
6, Centurion House, Sherman Avenue, Reading RG2 9TJ
| Today | See what it's worth now |
| 8 Apr 2026 | £252,000 |
| 30 Apr 2019 | £247,500 |
No other historical records.
76, Bearwood Road, Barkham RG41 4SY
| Today | See what it's worth now |
| 31 Mar 2026 | £870,000 |
| 21 Nov 2023 | £825,000 |
No other historical records.
1, Fox Close, Reading RG2 9TE

| Today | See what it's worth now |
| 20 Mar 2026 | £550,000 |
| 25 Oct 2019 | £510,000 |
No other historical records.
320, Barkham Road, Wokingham RG41 4DA
| Today | See what it's worth now |
| 19 Mar 2026 | £615,000 |
| 13 Jun 2018 | £530,000 |
No other historical records.
9, Fox Close, Reading RG2 9TE
| Today | See what it's worth now |
| 12 Mar 2026 | £422,500 |
| 18 Sep 2019 | £380,000 |
No other historical records.
15, Cherry Tree Grove, Wokingham RG41 4UZ
| Today | See what it's worth now |
| 20 Feb 2026 | £595,000 |
| 30 Nov 2001 | £236,000 |
No other historical records.
1, Langley Common Road, Wokingham RG40 4TU
| Today | See what it's worth now |
| 20 Feb 2026 | £800,000 |
| 16 Oct 2015 | £630,000 |
8, Waterman House, Oak Drive, Reading RG2 9GT
| Today | See what it's worth now |
| 10 Feb 2026 | £288,500 |
| 27 Oct 2016 | £305,000 |
No other historical records.
342, Barkham Road, Barkham RG41 4DE
| Today | See what it's worth now |
| 2 Feb 2026 | £500,930 |
| 26 Feb 2010 | £320,000 |
No other historical records.
4, Stirrup Walk, Arborfield Green RG2 9HL
| Today | See what it's worth now |
| 16 Jan 2026 | £670,000 |
| 30 Apr 2024 | £690,000 |
No other historical records.
1, Japonica Close, Wokingham RG41 4XJ
| Today | See what it's worth now |
| 15 Jan 2026 | £875,000 |
| 30 Apr 2015 | £575,000 |
No other historical records.
2, The Junipers, Barkham RG41 4UX

| Today | See what it's worth now |
| 12 Dec 2025 | £515,000 |
No other historical records.
42a, Bearwood Road, Wokingham RG41 4SY

| Today | See what it's worth now |
| 12 Dec 2025 | £580,000 |
| 20 Jul 2007 | £417,500 |
19, Cherry Tree Grove, Wokingham RG41 4UZ
| Today | See what it's worth now |
| 4 Dec 2025 | £610,000 |
| 13 Aug 2018 | £495,000 |
21, Somerville Close, Wokingham RG41 4SW
| Today | See what it's worth now |
| 27 Nov 2025 | £670,000 |
| 28 Apr 2017 | £515,000 |
56, Bearwood Road, Wokingham RG41 4SY

| Today | See what it's worth now |
| 25 Nov 2025 | £650,000 |
| 8 May 2009 | £400,000 |
22, Bearwood Road, Wokingham RG41 4TD
| Today | See what it's worth now |
| 12 Nov 2025 | £1,075,000 |
| 18 Mar 2022 | £875,000 |
19, Almond Close, Wokingham RG41 4UU
| Today | See what it's worth now |
| 11 Nov 2025 | £700,000 |
| 28 Jun 2021 | £650,000 |
5, Whitebeam Close, Barkham RG41 4SF
| Today | See what it's worth now |
| 31 Oct 2025 | £767,780 |
No other historical records.
72, Bearwood Road, Wokingham RG41 4SY
| Today | See what it's worth now |
| 29 Oct 2025 | £815,000 |
| 29 Jun 2017 | £600,000 |
No other historical records.
18, Thorn Close, Wokingham RG41 4SQ
| Today | See what it's worth now |
| 15 Sep 2025 | £767,500 |
| 7 Sep 2015 | £498,000 |
14, The Lilacs, Wokingham RG41 4UT
| Today | See what it's worth now |
| 1 Sep 2025 | £765,000 |
| 31 May 2002 | £276,000 |
No other historical records.
Source Acknowledgement: © Crown copyright. England and Wales house price data is publicly available information produced by the HM Land Registry.This material was last updated on 9 July 2026. It covers the period from 1 January 1995 to 30 April 2026 and contains property transactions which have been registered during that period. Contains HM Land Registry data © Crown copyright and database right 2026. This data is licensed under the Open Government Licence v3.0.
Disclaimer: Rightmove.co.uk provides this HM Land Registry data "as is". The burden for fitness of the data relies completely with the user and is provided for informational purposes only. No warranty, express or implied, is given relating to the accuracy of content of the HM Land Registry data and Rightmove does not accept any liability for error or omission. If you have found an error with the data or need further information please contact HM Land Registry.
Permitted Use: Viewers of this Information are granted permission to access this Crown copyright material and to download it onto electronic, magnetic, optical or similar storage media provided that such activities are for private research, study or in-house use only. Any other use of the material requires the formal written permission of Land Registry which can be requested from us, and is subject to an additional licence and associated charge.
Rightmove takes no liability for your use of, or reliance on, Rightmove's Instant Valuation due to the limitations of our tracking tool listed here. Use of this tool is taken entirely at your own risk. All rights reserved.