
House Prices in Barking
House prices in Barking have an overall average of £355,350 over the last year.
The majority of properties sold in Barking during the last year were flats, selling for an average price of £226,569. Terraced properties sold for an average of £456,599, with semi-detached properties fetching £537,056.
Overall, the historical sold prices in Barking over the last year were 7% down on the previous year and 4% down on the 2023 peak of £369,921.
Properties Sold
22, The Clarksons, Boundary Road West, Barking IG11 7JT

| Today | See today's value |
| 25 Aug 2026 | £255,000 |
| 16 May 2008 | £145,000 |
52, Oulton Crescent, Barking IG11 9HF
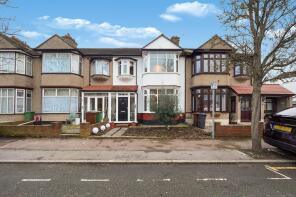
| Today | See today's value |
| 11 Aug 2026 | £525,000 |
| 23 Feb 2018 | £405,000 |
No other historical records.
7, Cuthberga Close, Barking IG11 8BS
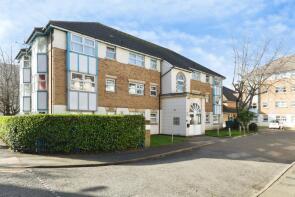
| Today | See today's value |
| 7 Aug 2026 | £230,000 |
| 21 Aug 1998 | £66,250 |
No other historical records.
27, Cowbridge Lane, Barking IG11 8LQ

| Today | See today's value |
| 7 Aug 2026 | £420,000 |
| 19 Oct 2010 | £162,500 |
2, Payne Close, Barking IG11 9PL
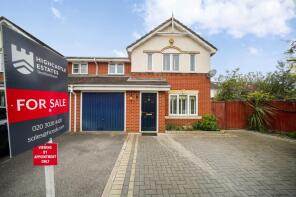
| Today | See today's value |
| 7 Aug 2026 | £585,000 |
No other historical records.
15, Endeavour Way, Barking IG11 0PF
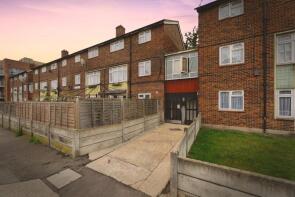
| Today | See today's value |
| 31 Jul 2026 | £190,000 |
| 6 Oct 2022 | £228,000 |
No other historical records.
Flat 30, 1, Harbard Close, Barking IG11 8SG
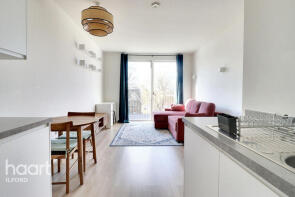
| Today | See today's value |
| 31 Jul 2026 | £189,000 |
| 10 Feb 2022 | £194,000 |
No other historical records.
Flat 21, Cromwell Lodge, Longbridge Road, Barking IG11 8UB

| Today | See today's value |
| 31 Jul 2026 | £90,000 |
| 22 Aug 2022 | £130,000 |
27, John Burns Drive, Barking IG11 9RQ
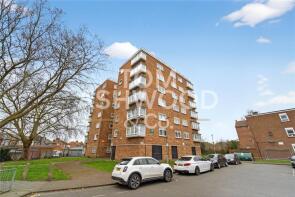
| Today | See today's value |
| 30 Jul 2026 | £150,000 |
| 8 Mar 2007 | £109,995 |
399, Bastable Avenue, Barking IG11 0QN
| Today | See today's value |
| 29 Jul 2026 | £375,000 |
| 12 Jun 2002 | £130,000 |
Flat 21, 1 Farsby House, Manwell Lane, Barking IG11 0WU
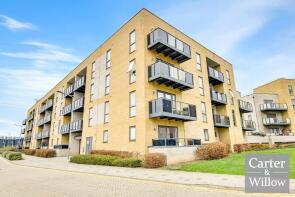
| Today | See today's value |
| 27 Jul 2026 | £302,500 |
| 27 Apr 2018 | £308,995 |
No other historical records.
432a, Longbridge Road, Barking IG11 9ED

| Today | See today's value |
| 24 Jul 2026 | £275,000 |
| 19 Feb 2010 | £150,000 |
195, Cavendish Gardens, Barking IG11 9DZ
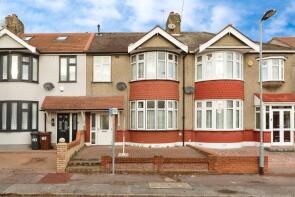
| Today | See today's value |
| 17 Jul 2026 | £510,000 |
No other historical records.
12, Keir Hardie Way, Barking IG11 9NY
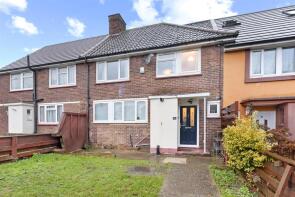
| Today | See today's value |
| 17 Jul 2026 | £500,000 |
| 18 Mar 2019 | £350,000 |
31, Harrow Road, Barking IG11 7QZ
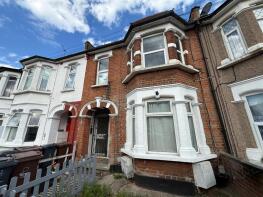
| Today | See today's value |
| 16 Jul 2026 | £277,000 |
No other historical records.
15, Pelham Avenue, Barking IG11 9SL

| Today | See today's value |
| 15 Jul 2026 | £475,000 |
| 25 Mar 2004 | £167,000 |
65, Sandhurst Drive, Seven Kings, Ilford IG3 9DD
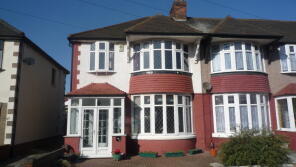
| Today | See today's value |
| 14 Jul 2026 | £400,000 |
| 22 Oct 2010 | £250,000 |
No other historical records.
50, Sherwood Gardens, Barking IG11 9TQ
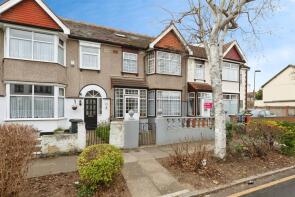
| Today | See today's value |
| 13 Jul 2026 | £540,000 |
| 19 Apr 2017 | £270,000 |
8, Thorpe Road, Barking IG11 9XJ
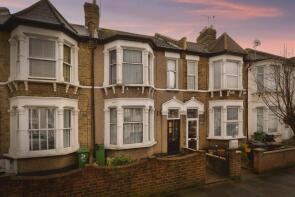
| Today | See today's value |
| 13 Jul 2026 | £421,000 |
| 27 Sep 2002 | £150,000 |
No other historical records.
717, 1 Schrier Ropeworks, Arboretum Place, Barking IG11 7FL
| Today | See today's value |
| 10 Jul 2026 | £240,000 |
| 3 Aug 2015 | £255,000 |
No other historical records.
104, 8 Teal Point, Drydock Square, Barking IG11 7ZE
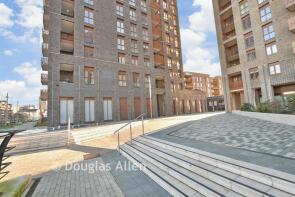
| Today | See today's value |
| 10 Jul 2026 | £365,000 |
| 29 Sep 2022 | £403,000 |
No other historical records.
151, Wilmington Gardens, Barking IG11 9TT

| Today | See today's value |
| 10 Jul 2026 | £690,000 |
| 16 Apr 2008 | £300,000 |
No other historical records.
36, Thurlestone Avenue, Seven Kings, Ilford IG3 9DU
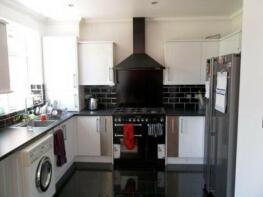
| Today | See today's value |
| 9 Jul 2026 | £250,000 |
| 12 Sep 2012 | £249,700 |
Rightmove takes no liability for your use of, or reliance on, Rightmove's Instant Valuation due to the limitations of our tracking tool listed here. Use of this tool is taken entirely at your own risk. All rights reserved.