
House Prices in Barnaby
House prices in Barnaby have an overall average of £166,364 over the last year.
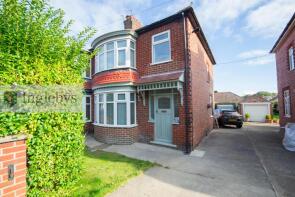
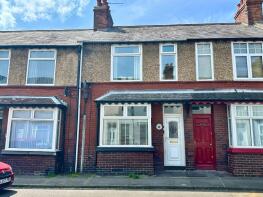
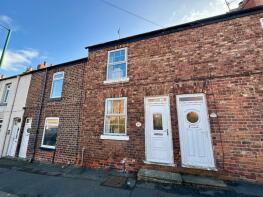
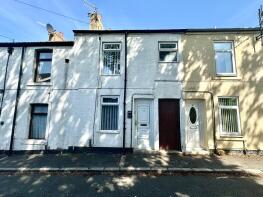
The majority of properties sold in Barnaby during the last year were terraced properties, selling for an average price of £122,262. Semi-detached properties sold for an average of £177,232, with detached properties fetching £359,722.
Overall, the historical sold prices in Barnaby over the last year were similar to the previous year and 7% up on the 2015 peak of £155,524.
Properties Sold
76, Great Auk, Guisborough TS14 8PQ
| Today | See what it's worth now |
| 6 Mar 2026 | £330,000 |
| 20 Sep 1996 | £112,000 |
No other historical records.
23, Thirlby Way, Guisborough TS14 6GN
| Today | See what it's worth now |
| 27 Feb 2026 | £280,000 |
| 28 Sep 2021 | £245,000 |
42, Eskdale Terrace, Guisborough TS14 6EQ
| Today | See what it's worth now |
| 23 Feb 2026 | £108,000 |
| 16 Jun 2004 | £90,000 |
34, Bolckow Street, Guisborough TS14 6EN
| Today | See what it's worth now |
| 18 Feb 2026 | £114,999 |
| 14 Jun 2023 | £98,750 |
3, Allerston Way, Guisborough TS14 6GA
| Today | See what it's worth now |
| 6 Feb 2026 | £250,000 |
| 30 May 2025 | £500,000 |
3, Reid Terrace, Guisborough TS14 6EB
| Today | See what it's worth now |
| 2 Feb 2026 | £110,000 |
| 8 Jan 2021 | £82,500 |
48, Allison Street, Guisborough TS14 6NX
| Today | See what it's worth now |
| 2 Feb 2026 | £84,000 |
| 13 Nov 2006 | £95,000 |
No other historical records.
30a, Cleveland Street, Guisborough TS14 6PF
| Today | See what it's worth now |
| 19 Dec 2025 | £79,950 |
| 7 Apr 2006 | £84,000 |
186, Woodhouse Road, Guisborough TS14 6LP
| Today | See what it's worth now |
| 19 Dec 2025 | £180,000 |
No other historical records.
34, Gill Street, Guisborough TS14 6EH
| Today | See what it's worth now |
| 18 Dec 2025 | £172,500 |
| 21 Jun 2019 | £115,000 |
No other historical records.
30, Beckside Gardens, Guisborough TS14 6DY
| Today | See what it's worth now |
| 18 Dec 2025 | £110,000 |
| 11 Aug 2017 | £166,329 |
No other historical records.
5, Allison Street, Guisborough TS14 6NX
| Today | See what it's worth now |
| 8 Dec 2025 | £118,000 |
| 29 Jan 2001 | £43,000 |
35, Beckside Gardens, Guisborough TS14 6DY
| Today | See what it's worth now |
| 1 Dec 2025 | £207,500 |
| 31 Aug 2016 | £249,999 |
No other historical records.
225, Westgate, Guisborough TS14 6NJ
| Today | See what it's worth now |
| 21 Nov 2025 | £103,000 |
| 24 Jun 2022 | £93,500 |
17, Hewitts Building, Guisborough TS14 6JR
| Today | See what it's worth now |
| 14 Nov 2025 | £114,000 |
| 22 Oct 2021 | £95,000 |
38, Priory Close, Guisborough TS14 6EL
| Today | See what it's worth now |
| 13 Nov 2025 | £225,000 |
| 5 Apr 2023 | £210,000 |
Stonelea, Hollymead Drive, Guisborough TS14 6EE
| Today | See what it's worth now |
| 13 Nov 2025 | £415,000 |
| 18 Jan 2008 | £250,000 |
93, Park Lane, Guisborough TS14 6PA
| Today | See what it's worth now |
| 7 Nov 2025 | £170,000 |
| 13 Aug 2012 | £110,000 |
No other historical records.
20, Hedley Street, Guisborough TS14 6EG
| Today | See what it's worth now |
| 6 Nov 2025 | £100,000 |
| 30 Nov 2020 | £95,000 |
1, Chaloner Hall Apartments, New Road, Guisborough TS14 6AS

| Today | See what it's worth now |
| 4 Nov 2025 | £130,000 |
| 23 Dec 2009 | £140,000 |
No other historical records.
28, West End, Guisborough TS14 6NW
| Today | See what it's worth now |
| 31 Oct 2025 | £300,000 |
| 23 Jul 2009 | £220,000 |
No other historical records.
66, Bolckow Street, Guisborough TS14 6EW
| Today | See what it's worth now |
| 29 Oct 2025 | £110,000 |
| 15 Feb 2013 | £83,000 |
12, Gill Street, Guisborough TS14 6EH
| Today | See what it's worth now |
| 24 Oct 2025 | £172,000 |
No other historical records.
159, Westgate, Guisborough TS14 6AN

| Today | See what it's worth now |
| 24 Oct 2025 | £130,000 |
| 12 Feb 2021 | £108,000 |
Greengates, Hollymead Drive, Guisborough TS14 6EE
| Today | See what it's worth now |
| 17 Oct 2025 | £320,000 |
| 24 Sep 2004 | £186,500 |
Source Acknowledgement: © Crown copyright. England and Wales house price data is publicly available information produced by the HM Land Registry.This material was last updated on 15 May 2026. It covers the period from 1 January 1995 to 31 March 2026 and contains property transactions which have been registered during that period. Contains HM Land Registry data © Crown copyright and database right 2026. This data is licensed under the Open Government Licence v3.0.
Disclaimer: Rightmove.co.uk provides this HM Land Registry data "as is". The burden for fitness of the data relies completely with the user and is provided for informational purposes only. No warranty, express or implied, is given relating to the accuracy of content of the HM Land Registry data and Rightmove does not accept any liability for error or omission. If you have found an error with the data or need further information please contact HM Land Registry.
Permitted Use: Viewers of this Information are granted permission to access this Crown copyright material and to download it onto electronic, magnetic, optical or similar storage media provided that such activities are for private research, study or in-house use only. Any other use of the material requires the formal written permission of Land Registry which can be requested from us, and is subject to an additional licence and associated charge.
Map data ©OpenStreetMap contributors.
Rightmove takes no liability for your use of, or reliance on, Rightmove's Instant Valuation due to the limitations of our tracking tool listed here. Use of this tool is taken entirely at your own risk. All rights reserved.