
House Prices in Barry
House prices in Barry have an overall average of £246,802 over the last year.
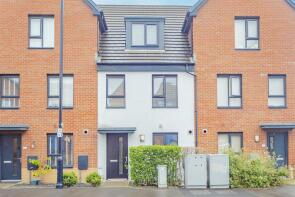
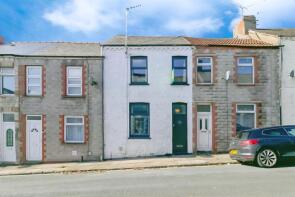
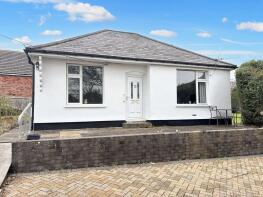
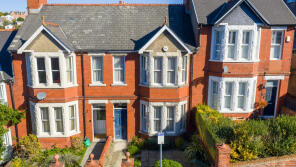
The majority of properties sold in Barry during the last year were terraced properties, selling for an average price of £230,233. Semi-detached properties sold for an average of £270,257, with flats fetching £146,300.
Overall, the historical sold prices in Barry over the last year were 3% up on the previous year and 7% up on the 2023 peak of £230,298.
Properties Sold
176, Phyllis Street, Barry CF62 5UU
| Today | See what it's worth now |
| 24 Apr 2026 | £257,500 |
| 7 Nov 2006 | £124,950 |
31 Flat 31, Glan Y Mor, Y Rhodfa, Barry CF63 4BB
| Today | See what it's worth now |
| 24 Apr 2026 | £180,000 |
| 12 Mar 2021 | £140,000 |
23, Gwalch Y Penwaig, Barry CF62 5AG
| Today | See what it's worth now |
| 21 Apr 2026 | £335,000 |
| 30 Apr 2015 | £221,000 |
11, Ewenny Close, Barry CF63 1QN
| Today | See what it's worth now |
| 15 Apr 2026 | £285,000 |
| 9 Apr 2015 | £160,000 |
No other historical records.
13, Carmarthen Close, Barry CF62 9AS
| Today | See what it's worth now |
| 15 Apr 2026 | £195,000 |
| 20 Mar 2020 | £125,000 |
83, Clive Road, Barry CF62 5UZ
| Today | See what it's worth now |
| 10 Apr 2026 | £230,000 |
| 22 Nov 2024 | £130,000 |
No other historical records.
7, Henry Street, Barry CF63 2RD
| Today | See what it's worth now |
| 10 Apr 2026 | £167,000 |
| 11 Mar 2022 | £152,000 |
151, Woodlands Road, Barry CF62 8ED

| Today | See what it's worth now |
| 10 Apr 2026 | £250,000 |
| 12 Mar 2004 | £118,000 |
No other historical records.
11, Morgan Street, Barry CF63 3NT
| Today | See what it's worth now |
| 10 Apr 2026 | £165,000 |
| 21 Oct 2011 | £86,500 |
No other historical records.
9, Conway Drive, Barry CF62 7EZ
| Today | See what it's worth now |
| 10 Apr 2026 | £335,000 |
| 16 Dec 2022 | £310,000 |
11, Heol Corswigen, Barry CF63 1AS
| Today | See what it's worth now |
| 10 Apr 2026 | £337,500 |
| 30 Aug 2019 | £240,000 |
46, Morel Street, Barry CF63 4PL
| Today | See what it's worth now |
| 2 Apr 2026 | £230,000 |
| 21 Sep 2007 | £134,000 |
2, Munro Place, Barry CF62 8BU
| Today | See what it's worth now |
| 2 Apr 2026 | £155,000 |
| 29 Jan 2021 | £155,000 |
4, O'donnell Road, Barry CF63 1RB
| Today | See what it's worth now |
| 2 Apr 2026 | £275,000 |
| 22 Aug 1997 | £52,500 |
No other historical records.
1 Ty Creigiau, Cwrt Dyfed, Barry CF63 1DZ
| Today | See what it's worth now |
| 2 Apr 2026 | £475,000 |
| 9 Jun 2016 | £232,000 |
3, Adar Y Mor, Barry CF62 5AF

| Today | See what it's worth now |
| 1 Apr 2026 | £285,000 |
| 16 Jan 2018 | £197,000 |
9, Ty Capstan, Rhodfa'r Gwagenni, Barry CF63 4AU

| Today | See what it's worth now |
| 31 Mar 2026 | £149,000 |
| 25 Jul 2014 | £107,000 |
2, Bedlington Terrace, Barry CF62 7JA
| Today | See what it's worth now |
| 30 Mar 2026 | £100,000 |
No other historical records.
19, Heol Fioled, Barry CF63 1HB
| Today | See what it's worth now |
| 28 Mar 2026 | £493,250 |
| 4 Oct 2022 | £425,000 |
46, Heol Ty Draw, Barry CF62 5DU

| Today | See what it's worth now |
| 27 Mar 2026 | £315,000 |
| 19 Feb 2021 | £240,000 |
No other historical records.
7, St Lythan's Road, Barry CF62 7NG
| Today | See what it's worth now |
| 27 Mar 2026 | £365,000 |
| 21 Jul 2016 | £213,000 |
10, Ffordd Y Mileniwm, Barry CF62 5AT
| Today | See what it's worth now |
| 27 Mar 2026 | £265,000 |
| 9 Jun 2017 | £189,000 |
No other historical records.
22, Davies Street, Barry CF63 1BX
| Today | See what it's worth now |
| 27 Mar 2026 | £152,000 |
| 18 May 2001 | £36,850 |
Source Acknowledgement: © Crown copyright. England and Wales house price data is publicly available information produced by the HM Land Registry.This material was last updated on 9 July 2026. It covers the period from 1 January 1995 to 30 April 2026 and contains property transactions which have been registered during that period. Contains HM Land Registry data © Crown copyright and database right 2026. This data is licensed under the Open Government Licence v3.0.
Disclaimer: Rightmove.co.uk provides this HM Land Registry data "as is". The burden for fitness of the data relies completely with the user and is provided for informational purposes only. No warranty, express or implied, is given relating to the accuracy of content of the HM Land Registry data and Rightmove does not accept any liability for error or omission. If you have found an error with the data or need further information please contact HM Land Registry.
Permitted Use: Viewers of this Information are granted permission to access this Crown copyright material and to download it onto electronic, magnetic, optical or similar storage media provided that such activities are for private research, study or in-house use only. Any other use of the material requires the formal written permission of Land Registry which can be requested from us, and is subject to an additional licence and associated charge.
Rightmove takes no liability for your use of, or reliance on, Rightmove's Instant Valuation due to the limitations of our tracking tool listed here. Use of this tool is taken entirely at your own risk. All rights reserved.