
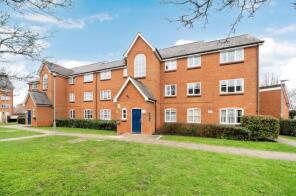
House Prices in Bedford
House prices in Bedford have an overall average of £351,368 over the last year.
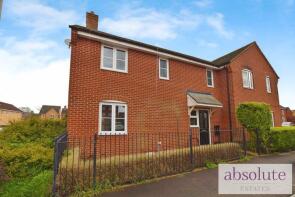
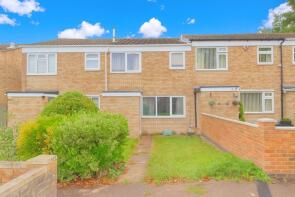
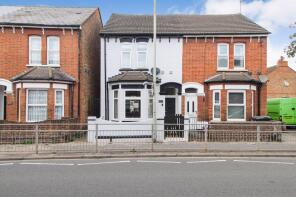
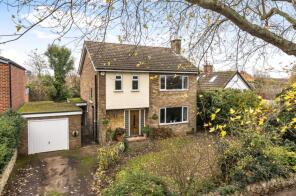
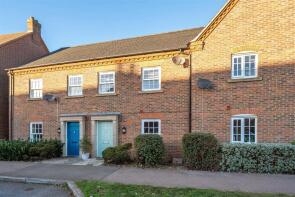
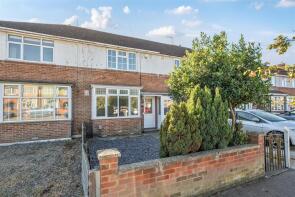
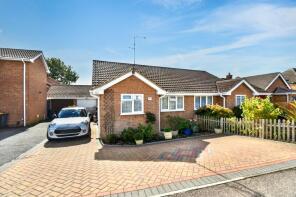
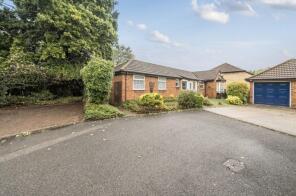
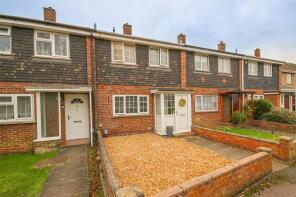
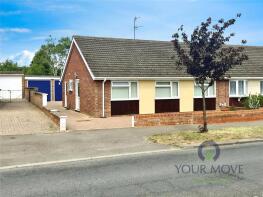
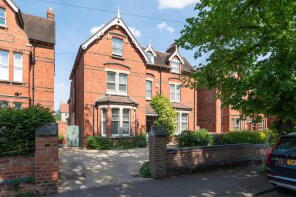
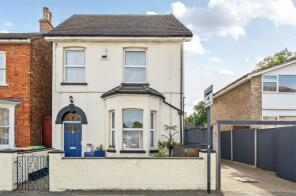
The majority of properties sold in Bedford during the last year were semi-detached properties, selling for an average price of £351,882. Terraced properties sold for an average of £293,776, with detached properties fetching £525,540.
Overall, the historical sold prices in Bedford over the last year were similar to the previous year and 6% up on the 2022 peak of £330,337.
Properties Sold
9, Meadfoot Place, Bedford MK41 7GH
| Today | See what it's worth now |
| 24 Apr 2026 | £305,000 |
| 30 Jun 2011 | £200,000 |
No other historical records.
4, Gleneagles Close, Bedford MK40 4GZ

| Today | See what it's worth now |
| 23 Apr 2026 | £462,000 |
| 6 Aug 2020 | £370,000 |
19, Westdale Walk, Bedford MK42 8NX
| Today | See what it's worth now |
| 21 Apr 2026 | £280,000 |
| 21 Jun 2004 | £117,500 |
No other historical records.
11, Roff Avenue, Bedford MK41 7TG
| Today | See what it's worth now |
| 17 Apr 2026 | £278,000 |
| 6 Jan 2023 | £265,000 |
5, Kenwyn Close, Bedford MK41 0GA

| Today | See what it's worth now |
| 17 Apr 2026 | £412,500 |
| 15 Dec 2011 | £217,495 |
No other historical records.
38, Polhill Avenue, Bedford MK41 9ED
| Today | See what it's worth now |
| 17 Apr 2026 | £595,000 |
| 18 Dec 2020 | £400,000 |
No other historical records.
61, The Grove, Bedford MK40 3JN
| Today | See what it's worth now |
| 17 Apr 2026 | £310,000 |
| 27 Mar 2024 | £285,000 |
No other historical records.
148, Greenkeepers Road, Bedford MK40 4GJ
| Today | See what it's worth now |
| 16 Apr 2026 | £335,000 |
| 24 Feb 2012 | £201,115 |
No other historical records.
151, Wendover Drive, Bedford MK41 9SS
| Today | See what it's worth now |
| 16 Apr 2026 | £247,000 |
| 20 Jul 2015 | £180,000 |
Flat 114, Britannia House, Palgrave Road, Bedford MK42 9BX

| Today | See what it's worth now |
| 16 Apr 2026 | £117,500 |
| 3 Nov 2009 | £109,500 |
No other historical records.
68a, Chantry Avenue, Bedford MK42 7RR
| Today | See what it's worth now |
| 16 Apr 2026 | £295,000 |
| 24 Apr 2020 | £230,000 |
No other historical records.
5, Vanguard Close, Bedford MK42 8UG
| Today | See what it's worth now |
| 15 Apr 2026 | £315,000 |
| 15 Oct 2002 | £149,995 |
10, Eden Way, Bedford MK41 7EP
| Today | See what it's worth now |
| 15 Apr 2026 | £261,000 |
| 20 Oct 2017 | £195,000 |
No other historical records.
16, Linnet Way, Bedford MK41 7HN
| Today | See what it's worth now |
| 14 Apr 2026 | £362,500 |
| 22 May 2024 | £357,500 |
124, Brookfield Road, Bedford MK41 9LL

| Today | See what it's worth now |
| 10 Apr 2026 | £310,000 |
| 14 Jun 2011 | £206,000 |
No other historical records.
17, Lansdowne Road, Bedford MK40 2BY
| Today | See what it's worth now |
| 10 Apr 2026 | £1,000,000 |
| 6 Sep 2010 | £675,000 |
No other historical records.
3, Spring Road, Bedford MK42 8LS
| Today | See what it's worth now |
| 8 Apr 2026 | £355,000 |
| 21 Oct 1998 | £97,000 |
No other historical records.
5, Lydford Close, Bedford MK40 3AZ

| Today | See what it's worth now |
| 7 Apr 2026 | £335,000 |
| 8 Nov 2019 | £255,000 |
No other historical records.
2, Stour Way, Bedford MK41 7BD

| Today | See what it's worth now |
| 2 Apr 2026 | £405,000 |
| 31 Jan 2013 | £190,000 |
No other historical records.
100, Crown Quay, Prebend Street, Bedford MK40 1BN
| Today | See what it's worth now |
| 2 Apr 2026 | £170,000 |
| 30 Jun 2017 | £157,500 |
3, Denby Rise, Bedford MK40 4WP
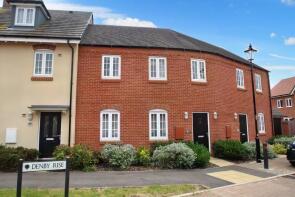
| Today | See what it's worth now |
| 2 Apr 2026 | £242,500 |
| 29 Jun 2018 | £223,995 |
No other historical records.
10, George Street, Bedford MK40 3SG
| Today | See what it's worth now |
| 2 Apr 2026 | £392,500 |
| 27 Apr 2018 | £346,840 |
4, Belfry Close, Bedford MK42 9RQ
| Today | See what it's worth now |
| 2 Apr 2026 | £348,000 |
| 26 Jan 2006 | £177,000 |
Source Acknowledgement: © Crown copyright. England and Wales house price data is publicly available information produced by the HM Land Registry.This material was last updated on 9 July 2026. It covers the period from 1 January 1995 to 30 April 2026 and contains property transactions which have been registered during that period. Contains HM Land Registry data © Crown copyright and database right 2026. This data is licensed under the Open Government Licence v3.0.
Disclaimer: Rightmove.co.uk provides this HM Land Registry data "as is". The burden for fitness of the data relies completely with the user and is provided for informational purposes only. No warranty, express or implied, is given relating to the accuracy of content of the HM Land Registry data and Rightmove does not accept any liability for error or omission. If you have found an error with the data or need further information please contact HM Land Registry.
Permitted Use: Viewers of this Information are granted permission to access this Crown copyright material and to download it onto electronic, magnetic, optical or similar storage media provided that such activities are for private research, study or in-house use only. Any other use of the material requires the formal written permission of Land Registry which can be requested from us, and is subject to an additional licence and associated charge.
Rightmove takes no liability for your use of, or reliance on, Rightmove's Instant Valuation due to the limitations of our tracking tool listed here. Use of this tool is taken entirely at your own risk. All rights reserved.