
House Prices in Biddenham
House prices in Biddenham have an overall average of £425,597 over the last year.
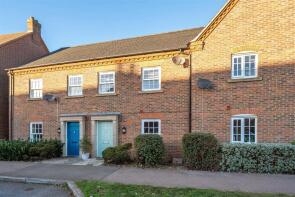
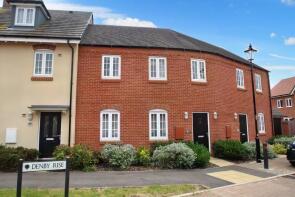
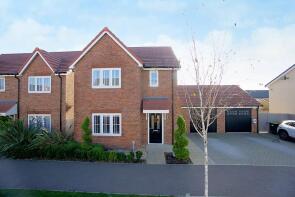
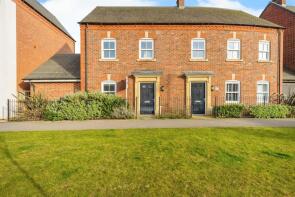
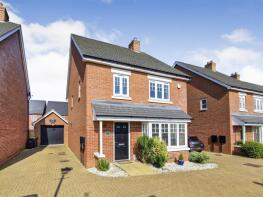
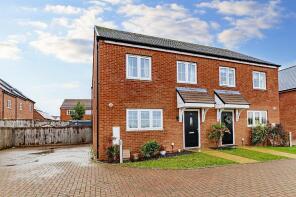
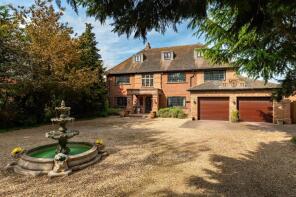
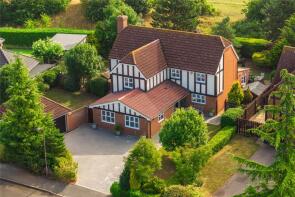
The majority of properties sold in Biddenham during the last year were detached properties, selling for an average price of £575,521. Semi-detached properties sold for an average of £302,471, with terraced properties fetching £342,912.
Overall, the historical sold prices in Biddenham over the last year were 11% down on the previous year and 7% down on the 2023 peak of £456,414.
Properties Sold
4, Gleneagles Close, Bedford MK40 4GZ

| Today | See what it's worth now |
| 23 Apr 2026 | £462,000 |
| 6 Aug 2020 | £370,000 |
148, Greenkeepers Road, Bedford MK40 4GJ
| Today | See what it's worth now |
| 16 Apr 2026 | £335,000 |
| 24 Feb 2012 | £201,115 |
No other historical records.
3, Denby Rise, Bedford MK40 4WP
| Today | See what it's worth now |
| 2 Apr 2026 | £242,500 |
| 29 Jun 2018 | £223,995 |
No other historical records.
9, Peacock Lane, Bedford MK40 4WS
| Today | See what it's worth now |
| 31 Mar 2026 | £440,000 |
| 24 Jun 2022 | £407,000 |
No other historical records.
54, King Alfred Way, Bedford MK40 4SH
| Today | See what it's worth now |
| 31 Mar 2026 | £240,000 |
| 24 Mar 2016 | £195,995 |
No other historical records.
16, Malcote Close, Bedford MK40 4QW
| Today | See what it's worth now |
| 27 Mar 2026 | £320,000 |
| 18 Jun 1999 | £79,995 |
No other historical records.
6, Alwin Court, Bedford MK40 4SP
| Today | See what it's worth now |
| 26 Mar 2026 | £347,500 |
| 8 Nov 2018 | £305,000 |
41, Broad Mead Avenue, Bedford MK40 4SA
| Today | See what it's worth now |
| 26 Mar 2026 | £575,000 |
| 29 Apr 2021 | £518,000 |
9, Alwin Court, Bedford MK40 4SP
| Today | See what it's worth now |
| 20 Mar 2026 | £517,500 |
| 12 Oct 2016 | £364,995 |
No other historical records.
12, Ellesmere Gardens, Bedford MK40 4TZ
| Today | See what it's worth now |
| 16 Mar 2026 | £425,000 |
| 25 Jan 2019 | £359,995 |
No other historical records.
23, Kingswood Way, Bedford MK40 4GH
| Today | See what it's worth now |
| 6 Mar 2026 | £195,000 |
| 30 Mar 2017 | £196,995 |
No other historical records.
12, Muscovy Mews, Biddenham MK40 4WE
| Today | See what it's worth now |
| 6 Mar 2026 | £148,000 |
No other historical records.
94 Redlands, Bromham Road, Bedford MK40 4AH
| Today | See what it's worth now |
| 27 Feb 2026 | £1,200,000 |
| 28 Jun 2007 | £640,000 |
No other historical records.
Flat 14, Saxon Court, Terrington Place, Bedford MK40 4WR
| Today | See what it's worth now |
| 26 Feb 2026 | £84,000 |
| 20 Sep 2019 | £82,398 |
No other historical records.
1, Darlow Drive, Bedford MK40 4AX
| Today | See what it's worth now |
| 18 Feb 2026 | £850,000 |
| 5 Nov 2004 | £480,000 |
34, Lacewing Drive, Bedford MK40 4UP
| Today | See what it's worth now |
| 16 Feb 2026 | £625,000 |
| 16 Dec 2019 | £489,995 |
No other historical records.
6, Eider Grange, Biddenham MK40 4UZ
| Today | See what it's worth now |
| 11 Feb 2026 | £144,000 |
No other historical records.
6, Fleming Close, Bedford MK40 4QT
| Today | See what it's worth now |
| 5 Feb 2026 | £575,000 |
| 3 Nov 2017 | £343,000 |
41, Dragonfly Crescent, Bedford MK40 4UB
| Today | See what it's worth now |
| 29 Jan 2026 | £349,000 |
No other historical records.
7, Carnoustie Drive, Bedford MK40 4FE
| Today | See what it's worth now |
| 27 Jan 2026 | £935,000 |
| 23 Dec 1997 | £80,000 |
No other historical records.
13, Deep Spinney, Bedford MK40 4QJ
| Today | See what it's worth now |
| 23 Jan 2026 | £430,000 |
| 2 Nov 2022 | £427,000 |
15, Winchell Mews, Bedford MK40 4TY
| Today | See what it's worth now |
| 23 Jan 2026 | £480,000 |
| 15 Dec 2017 | £389,995 |
No other historical records.
54, Danegeld Avenue, Bedford MK40 4SS
| Today | See what it's worth now |
| 9 Jan 2026 | £225,000 |
| 1 Nov 2019 | £216,995 |
No other historical records.

Source Acknowledgement: © Crown copyright. England and Wales house price data is publicly available information produced by the HM Land Registry.This material was last updated on 9 July 2026. It covers the period from 1 January 1995 to 30 April 2026 and contains property transactions which have been registered during that period. Contains HM Land Registry data © Crown copyright and database right 2026. This data is licensed under the Open Government Licence v3.0.
Disclaimer: Rightmove.co.uk provides this HM Land Registry data "as is". The burden for fitness of the data relies completely with the user and is provided for informational purposes only. No warranty, express or implied, is given relating to the accuracy of content of the HM Land Registry data and Rightmove does not accept any liability for error or omission. If you have found an error with the data or need further information please contact HM Land Registry.
Permitted Use: Viewers of this Information are granted permission to access this Crown copyright material and to download it onto electronic, magnetic, optical or similar storage media provided that such activities are for private research, study or in-house use only. Any other use of the material requires the formal written permission of Land Registry which can be requested from us, and is subject to an additional licence and associated charge.
Rightmove takes no liability for your use of, or reliance on, Rightmove's Instant Valuation due to the limitations of our tracking tool listed here. Use of this tool is taken entirely at your own risk. All rights reserved.