
House Prices in Beeston Rylands
House prices in Beeston Rylands have an overall average of £264,770 over the last year.
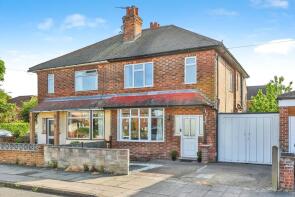
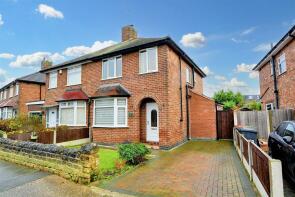
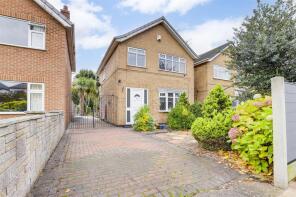
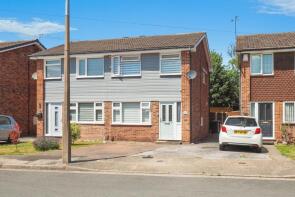
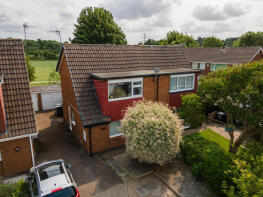
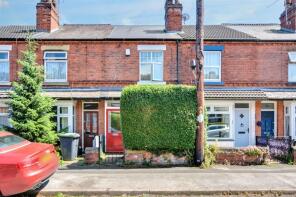
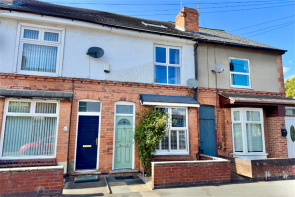
The majority of properties sold in Beeston Rylands during the last year were semi-detached properties, selling for an average price of £272,152. Terraced properties sold for an average of £232,364, with detached properties fetching £372,667.
Overall, the historical sold prices in Beeston Rylands over the last year were 7% down on the previous year and 20% down on the 2023 peak of £331,699.
Properties Sold
22, Rose Grove, Nottingham NG9 1PB
| Today | See what it's worth now |
| 9 Apr 2026 | £307,500 |
| 12 Jan 2015 | £141,500 |
56, East Crescent, Nottingham NG9 1QA
| Today | See what it's worth now |
| 26 Feb 2026 | £300,000 |
| 26 May 2006 | £119,500 |
No other historical records.
132, Meadow Road, Beeston NG9 1JR
| Today | See what it's worth now |
| 23 Feb 2026 | £320,000 |
No other historical records.
33, Alford Close, Nottingham NG9 1QP
| Today | See what it's worth now |
| 19 Feb 2026 | £263,000 |
| 24 Oct 2014 | £115,000 |
16, Rose Grove, Beeston NG9 1PB
| Today | See what it's worth now |
| 30 Jan 2026 | £200,000 |
No other historical records.
43, Trent Road, Nottingham NG9 1LJ
| Today | See what it's worth now |
| 5 Jan 2026 | £233,000 |
| 14 Jun 2024 | £180,000 |
7, Lockwood Close, Nottingham NG9 1NP
| Today | See what it's worth now |
| 18 Dec 2025 | £246,000 |
| 14 Jun 2016 | £125,000 |
No other historical records.
62, Leyton Crescent, Nottingham NG9 1PT
| Today | See what it's worth now |
| 16 Dec 2025 | £210,000 |
| 1 Nov 2013 | £133,000 |
40, Trafalgar Road, Beeston NG9 1LB

| Today | See what it's worth now |
| 12 Dec 2025 | £205,000 |
No other historical records.
35, Thorndike Close, Beeston NG9 1LS
| Today | See what it's worth now |
| 12 Dec 2025 | £160,000 |
No other historical records.
27, Lilac Grove, Nottingham NG9 1PA
| Today | See what it's worth now |
| 10 Dec 2025 | £262,600 |
| 7 Mar 2022 | £250,000 |
No other historical records.
62, Trafalgar Road, Nottingham NG9 1LB

| Today | See what it's worth now |
| 10 Dec 2025 | £224,000 |
| 3 Sep 2007 | £122,000 |
30, East Crescent, Nottingham NG9 1QA
| Today | See what it's worth now |
| 24 Nov 2025 | £240,000 |
| 25 Nov 2016 | £149,950 |
No other historical records.
108, Meadow Road, Nottingham NG9 1JS
| Today | See what it's worth now |
| 14 Nov 2025 | £240,000 |
| 31 Aug 2022 | £225,000 |
16, Multimode Close, Nottingham NG9 1NY
| Today | See what it's worth now |
| 11 Nov 2025 | £255,000 |
| 28 Jul 2022 | £240,995 |
No other historical records.
37, West Crescent, Nottingham NG9 1QF
| Today | See what it's worth now |
| 24 Oct 2025 | £297,000 |
| 29 Jun 2020 | £230,000 |
101, Regeneration Way, Nottingham NG9 1NJ

| Today | See what it's worth now |
| 23 Oct 2025 | £413,000 |
| 27 Apr 2023 | £434,995 |
No other historical records.
66, Beech Avenue, Nottingham NG9 1QD
| Today | See what it's worth now |
| 16 Oct 2025 | £300,000 |
| 28 Mar 2019 | £212,000 |
23, Regeneration Way, Nottingham NG9 1NJ
| Today | See what it's worth now |
| 16 Oct 2025 | £355,000 |
| 24 Jun 2021 | £322,995 |
No other historical records.
37, Appleton Road, Nottingham NG9 1NE
| Today | See what it's worth now |
| 15 Oct 2025 | £250,000 |
| 13 Oct 2011 | £145,000 |
73, Elswick Drive, Nottingham NG9 1NQ
| Today | See what it's worth now |
| 10 Oct 2025 | £237,500 |
| 25 Oct 1999 | £57,500 |
No other historical records.
10, West Crescent, Nottingham NG9 1QE
| Today | See what it's worth now |
| 2 Oct 2025 | £290,000 |
| 23 Aug 2018 | £205,000 |
No other historical records.
36, Trent Road, Nottingham NG9 1LJ

| Today | See what it's worth now |
| 30 Sep 2025 | £385,000 |
| 20 Jun 2003 | £184,000 |
No other historical records.
Source Acknowledgement: © Crown copyright. England and Wales house price data is publicly available information produced by the HM Land Registry.This material was last updated on 9 July 2026. It covers the period from 1 January 1995 to 30 April 2026 and contains property transactions which have been registered during that period. Contains HM Land Registry data © Crown copyright and database right 2026. This data is licensed under the Open Government Licence v3.0.
Disclaimer: Rightmove.co.uk provides this HM Land Registry data "as is". The burden for fitness of the data relies completely with the user and is provided for informational purposes only. No warranty, express or implied, is given relating to the accuracy of content of the HM Land Registry data and Rightmove does not accept any liability for error or omission. If you have found an error with the data or need further information please contact HM Land Registry.
Permitted Use: Viewers of this Information are granted permission to access this Crown copyright material and to download it onto electronic, magnetic, optical or similar storage media provided that such activities are for private research, study or in-house use only. Any other use of the material requires the formal written permission of Land Registry which can be requested from us, and is subject to an additional licence and associated charge.
Rightmove takes no liability for your use of, or reliance on, Rightmove's Instant Valuation due to the limitations of our tracking tool listed here. Use of this tool is taken entirely at your own risk. All rights reserved.