
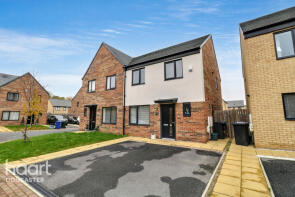
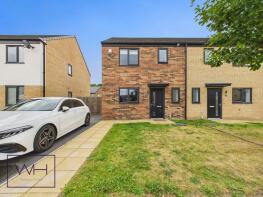
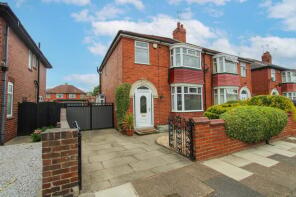
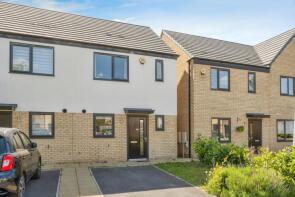
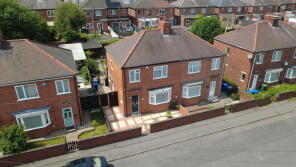
House Prices in Belle Vue
House prices in Belle Vue have an overall average of £181,009 over the last year.
The majority of properties sold in Belle Vue during the last year were semi-detached properties, selling for an average price of £178,181. Terraced properties sold for an average of £169,800, with detached properties fetching £233,333.
Overall, the historical sold prices in Belle Vue over the last year were 5% up on the previous year and 6% down on the 2020 peak of £191,944.
Properties Sold
14, Pond Close, Lakeside, Doncaster DN4 5NY
| Today | See what it's worth now |
| 20 Mar 2026 | £180,000 |
| 16 Jul 2021 | £219,945 |
No other historical records.
17, Swan Road, Lakeside, Doncaster DN4 5NX
| Today | See what it's worth now |
| 11 Mar 2026 | £221,250 |
| 28 Jun 2021 | £208,995 |
No other historical records.
5, Firbeck Road, Bennetthorpe, Doncaster DN4 5HB
| Today | See what it's worth now |
| 5 Mar 2026 | £235,000 |
No other historical records.
32, St Ursulas Road, Belle Vue, Doncaster DN4 5ED
| Today | See what it's worth now |
| 3 Mar 2026 | £150,000 |
| 30 Jun 2021 | £57,000 |
No other historical records.
5, Swan Road, Lakeside, Doncaster DN4 5NX
| Today | See what it's worth now |
| 25 Feb 2026 | £180,000 |
| 27 Nov 2020 | £166,995 |
No other historical records.
19, Town End Drive, Belle Vue, Doncaster DN4 5FQ
| Today | See what it's worth now |
| 25 Feb 2026 | £220,000 |
| 22 May 2017 | £199,995 |
No other historical records.
48, St Cecilias Road, Belle Vue, Doncaster DN4 5EG
| Today | See what it's worth now |
| 18 Feb 2026 | £220,000 |
| 29 Jul 2011 | £130,000 |
31, St Margarets Road, Belle Vue, Doncaster DN4 5EL
| Today | See what it's worth now |
| 13 Feb 2026 | £150,000 |
| 17 May 2018 | £119,000 |
57, St Hildas Road, Belle Vue, Doncaster DN4 5EE
| Today | See what it's worth now |
| 6 Feb 2026 | £140,000 |
| 7 Feb 2003 | £75,500 |
No other historical records.
63, Chequer Avenue, Belle Vue, Doncaster DN4 5AR
| Today | See what it's worth now |
| 30 Jan 2026 | £165,000 |
| 20 Aug 2003 | £98,000 |
6, Firbeck Road, Bennetthorpe, Doncaster DN4 5HB
| Today | See what it's worth now |
| 19 Dec 2025 | £210,000 |
| 27 Nov 2014 | £137,000 |
17, Chester Drive, Lakeside, Doncaster DN4 5NS

| Today | See what it's worth now |
| 19 Dec 2025 | £195,000 |
| 19 Dec 2019 | £163,995 |
No other historical records.
292, Carr House Road, Belle Vue, Doncaster DN4 5DU
| Today | See what it's worth now |
| 18 Dec 2025 | £130,000 |
| 30 Mar 2012 | £69,000 |
No other historical records.
16, Rovers Way, Belle Vue, Doncaster DN4 5FP
| Today | See what it's worth now |
| 18 Dec 2025 | £340,000 |
| 29 Nov 2018 | £257,995 |
No other historical records.
7, Swan Road, Lakeside, Doncaster DN4 5NX

| Today | See what it's worth now |
| 17 Nov 2025 | £187,000 |
| 27 Nov 2020 | £174,495 |
No other historical records.
41, Stockil Road, Belle Vue, Doncaster DN4 5AU
| Today | See what it's worth now |
| 17 Oct 2025 | £117,000 |
| 27 Feb 2004 | £46,650 |
No other historical records.
8, Belle Vue Avenue, Belle Vue, Doncaster DN4 5DX

| Today | See what it's worth now |
| 2 Oct 2025 | £205,000 |
No other historical records.
28, St Agnes Road, Belle Vue, Doncaster DN4 5EF
| Today | See what it's worth now |
| 29 Sep 2025 | £160,000 |
No other historical records.
19, Swan Road, Lakeside, Doncaster DN4 5NX
| Today | See what it's worth now |
| 19 Sep 2025 | £225,000 |
| 30 Jun 2021 | £208,995 |
No other historical records.
17, Blackberry Road, Lakeside, Doncaster DN4 5NZ
| Today | See what it's worth now |
| 17 Sep 2025 | £210,000 |
No other historical records.
30, Town End Drive, Belle Vue, Doncaster DN4 5FQ
| Today | See what it's worth now |
| 16 Sep 2025 | £195,000 |
| 8 Oct 2018 | £174,495 |
No other historical records.
21, Chequer Avenue, Belle Vue, Doncaster DN4 5AR
| Today | See what it's worth now |
| 10 Sep 2025 | £135,000 |
| 31 Mar 2006 | £72,000 |
No other historical records.
7, Blackberry Road, Lakeside, Doncaster DN4 5NZ
| Today | See what it's worth now |
| 5 Sep 2025 | £183,000 |
| 16 Apr 2021 | £179,995 |
No other historical records.
Source Acknowledgement: © Crown copyright. England and Wales house price data is publicly available information produced by the HM Land Registry.This material was last updated on 9 July 2026. It covers the period from 1 January 1995 to 30 April 2026 and contains property transactions which have been registered during that period. Contains HM Land Registry data © Crown copyright and database right 2026. This data is licensed under the Open Government Licence v3.0.
Disclaimer: Rightmove.co.uk provides this HM Land Registry data "as is". The burden for fitness of the data relies completely with the user and is provided for informational purposes only. No warranty, express or implied, is given relating to the accuracy of content of the HM Land Registry data and Rightmove does not accept any liability for error or omission. If you have found an error with the data or need further information please contact HM Land Registry.
Permitted Use: Viewers of this Information are granted permission to access this Crown copyright material and to download it onto electronic, magnetic, optical or similar storage media provided that such activities are for private research, study or in-house use only. Any other use of the material requires the formal written permission of Land Registry which can be requested from us, and is subject to an additional licence and associated charge.
Rightmove takes no liability for your use of, or reliance on, Rightmove's Instant Valuation due to the limitations of our tracking tool listed here. Use of this tool is taken entirely at your own risk. All rights reserved.