
House Prices in Bellfield
House prices in Bellfield have an overall average of £101,973 over the last year.
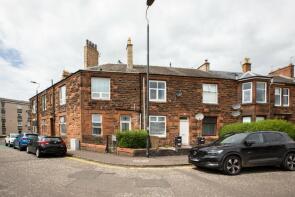
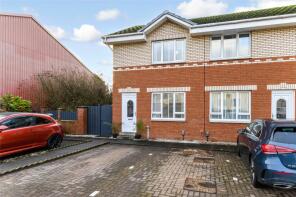
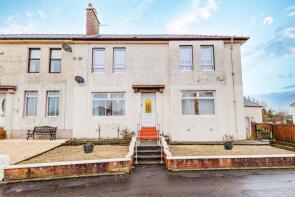
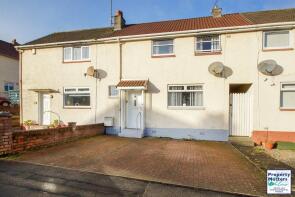
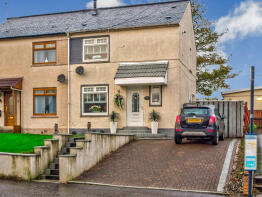
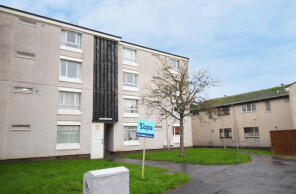
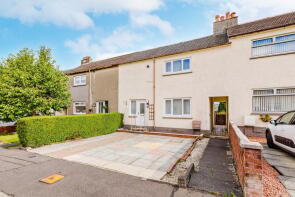
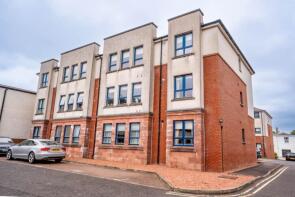
The majority of properties sold in Bellfield during the last year were flats, selling for an average price of £78,027. Terraced properties sold for an average of £115,733, with semi-detached properties fetching £146,552.
Overall, the historical sold prices in Bellfield over the last year were similar to the previous year and 7% up on the 2008 peak of £95,065.
Properties Sold
6, Ardle Avenue, Bellfield, Kilmarnock KA1 3PU

| Today | See what it's worth now |
| 27 Apr 2026 | £90,000 |
| 26 Jul 2017 | £75,000 |
No other historical records.
157, Hurlford Road, Bellfield, Kilmarnock KA1 3QA
| Today | See what it's worth now |
| 23 Apr 2026 | £135,500 |
| 4 Mar 2016 | £62,000 |
22, Old Mill Road, Kilmarnock KA1 3AW
| Today | See what it's worth now |
| 21 Apr 2026 | £50,000 |
| 7 Feb 2008 | £86,000 |
9, Middlemas Drive, Kilmarnock KA1 3DZ
| Today | See what it's worth now |
| 20 Apr 2026 | £70,000 |
| 11 Nov 2004 | £65,000 |
No other historical records.
1, Spey Avenue, Bellfield, Kilmarnock KA1 3PG
| Today | See what it's worth now |
| 9 Apr 2026 | £140,000 |
No other historical records.
6, Willie Mckelvey Brae, Kilmarnock KA1 3AD
| Today | See what it's worth now |
| 3 Apr 2026 | £237,037 |
| 5 Sep 2017 | £159,995 |
No other historical records.
2b, Bellsland Place, Kilmarnock KA1 3HJ
| Today | See what it's worth now |
| 30 Mar 2026 | £55,000 |
| 26 Oct 2009 | £58,000 |
No other historical records.
1d, Newton Walk, Kilmarnock KA1 3HN
| Today | See what it's worth now |
| 30 Mar 2026 | £49,000 |
| 23 Oct 2015 | £26,000 |
No other historical records.
Flat A, 27, Mackinlay Place, Kilmarnock KA1 3DN

| Today | See what it's worth now |
| 26 Mar 2026 | £52,000 |
| 23 Sep 2011 | £42,000 |
No other historical records.
53, Pentland Road, Bellfield, Kilmarnock KA1 3RU
| Today | See what it's worth now |
| 25 Mar 2026 | £75,000 |
| 8 Aug 2008 | £95,000 |
8, Mitchell Court, Kilmarnock KA1 3DU
| Today | See what it's worth now |
| 24 Mar 2026 | £160,000 |
| 13 Mar 2015 | £110,000 |
No other historical records.
Flat Ground 2, 51, Glebe Road, Kilmarnock KA1 3DJ
| Today | See what it's worth now |
| 24 Mar 2026 | £32,000 |
| 16 Jul 2025 | £61,000 |
53, Mackinlay Place, Kilmarnock KA1 3DN
| Today | See what it's worth now |
| 20 Mar 2026 | £150,100 |
| 10 Oct 2022 | £136,200 |
34, New Mill Road, Kilmarnock KA1 3JB
| Today | See what it's worth now |
| 17 Mar 2026 | £75,000 |
No other historical records.
42, Kinloch Road, Bellfield, Kilmarnock KA1 3NY
| Today | See what it's worth now |
| 16 Mar 2026 | £110,500 |
| 20 Nov 2023 | £86,000 |
No other historical records.
36, Victoria Terrace, Kilmarnock KA1 3JR
| Today | See what it's worth now |
| 11 Mar 2026 | £115,000 |
| 5 Oct 2007 | £117,950 |
No other historical records.
50, Loudoun Avenue, Bellfield, Kilmarnock KA1 3RZ

| Today | See what it's worth now |
| 9 Mar 2026 | £130,500 |
| 15 Jul 2014 | £55,000 |
No other historical records.
25, Academy Apartments, Elmbank Avenue, Kilmarnock KA1 3BT

| Today | See what it's worth now |
| 4 Mar 2026 | £150,000 |
No other historical records.
15f, Kirktonholm Place, Kilmarnock KA1 3HW
| Today | See what it's worth now |
| 4 Mar 2026 | £55,000 |
| 27 Aug 2024 | £37,200 |
14, Teith Place, Bellfield, Kilmarnock KA1 3PR
| Today | See what it's worth now |
| 27 Feb 2026 | £122,000 |
| 5 Oct 2016 | £79,500 |
4, Cheviot Place, Bellfield, Kilmarnock KA1 3RX
| Today | See what it's worth now |
| 26 Feb 2026 | £75,000 |
No other historical records.
6, Tinto Avenue, Bellfield, Kilmarnock KA1 3SJ
| Today | See what it's worth now |
| 25 Feb 2026 | £120,005 |
| 29 Dec 2006 | £56,950 |
No other historical records.
10c, Gallion Walk, Kilmarnock KA1 3HB
| Today | See what it's worth now |
| 23 Feb 2026 | £67,500 |
| 4 Apr 2024 | £48,000 |
Source Acknowledgement: © Crown copyright. Scottish house price data is publicly available information produced by the Registers of Scotland. Material has been reproduced with the permission of the Keeper of the Registers of Scotland and contains data compiled by Registers of Scotland. For further information, please contact data@ros.gov.uk. Please note the dates shown here relate to the property's registered date not sold date.This material was last updated on 10 July 2026. It covers the period from 8 December 1987 to 30 April 2026 and contains property transactions which have been registered during that period.
Disclaimer: Rightmove.co.uk provides this Registers of Scotland data "as is". The burden for fitness of the data relies completely with the user and is provided for informational purposes only. No warranty, express or implied, is given relating to the accuracy of content of the Registers of Scotland data and Rightmove plc does not accept any liability for error or omission. If you have found an error with the data or need further information please contact data@ros.gov.uk
Permitted Use: The Registers of Scotland allows the reproduction of the data which it provides to Rightmove.co.uk free of charge in any format or medium only for research, private study or for internal circulation within an organisation. This is subject to it being reproduced accurately and not used in a misleading context. The material must be acknowledged as Crown Copyright. You are not allowed to use this information for commercial purposes, nor must you copy, distribute, sell or publish the data in any way. For any other use of this material, please apply to the Registers of Scotland for a licence. You can do this online at www.ros.gov.uk, by email at data@ros.gov.uk or by writing to Business Development, Registers of Scotland, Meadowbank House, 153 London Road, Edinburgh EH8 7AU.
Rightmove takes no liability for your use of, or reliance on, Rightmove's Instant Valuation due to the limitations of our tracking tool listed here. Use of this tool is taken entirely at your own risk. All rights reserved.