
House Prices in Biggar
House prices in Biggar have an overall average of £168,903 over the last year.
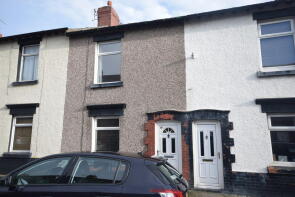
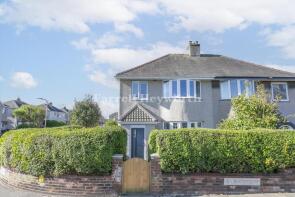
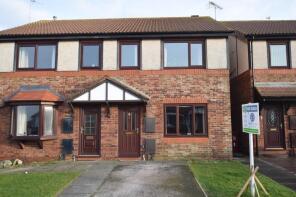
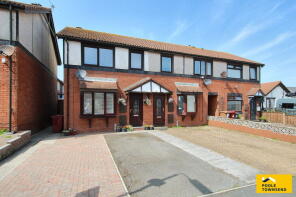
The majority of properties sold in Biggar during the last year were terraced properties, selling for an average price of £141,686. Semi-detached properties sold for an average of £206,777, with detached properties fetching £278,500.
Overall, the historical sold prices in Biggar over the last year were 9% up on the previous year and 8% up on the 2023 peak of £156,788.
Properties Sold
11, Witham Walk, Barrow-in-furness LA14 3XB
| Today | See what it's worth now |
| 23 Mar 2026 | £142,500 |
| 16 Mar 2016 | £82,500 |
50, Tyne Road, Barrow-in-furness LA14 3NA
| Today | See what it's worth now |
| 19 Mar 2026 | £175,500 |
| 21 Dec 2020 | £120,000 |
No other historical records.
11, Naiad Street, Barrow-in-furness LA14 3EF
| Today | See what it's worth now |
| 18 Mar 2026 | £92,000 |
| 16 Aug 2019 | £95,000 |
64, Trent Vale, Barrow-in-furness LA14 3NB
| Today | See what it's worth now |
| 6 Mar 2026 | £130,000 |
| 19 Oct 1998 | £23,500 |
No other historical records.
79, Shearwater Crescent, Barrow-in-furness LA14 3JP
| Today | See what it's worth now |
| 3 Mar 2026 | £175,000 |
| 30 Aug 2023 | £155,000 |
26, Ocean Road, Barrow-in-furness LA14 3DX
| Today | See what it's worth now |
| 2 Mar 2026 | £170,000 |
| 5 Aug 2013 | £120,000 |
25, Baden Powell Street, Barrow-in-furness LA14 3QD
| Today | See what it's worth now |
| 2 Mar 2026 | £172,000 |
| 12 Aug 2025 | £160,000 |
6, Medway Road, Barrow-in-furness LA14 3LU
| Today | See what it's worth now |
| 2 Mar 2026 | £157,000 |
| 25 Jul 2008 | £119,000 |
No other historical records.
39, Dartmouth Street, Barrow-in-furness LA14 3AS
| Today | See what it's worth now |
| 19 Feb 2026 | £115,000 |
| 8 Mar 2024 | £79,500 |
1, Black Butts Lane, Barrow-in-furness LA14 3DF
| Today | See what it's worth now |
| 10 Feb 2026 | £290,000 |
| 7 Oct 2024 | £279,000 |
3, Blythe Rise, Barrow-in-furness LA14 3XD
| Today | See what it's worth now |
| 10 Feb 2026 | £156,990 |
| 14 Jun 2019 | £110,000 |
43, Irwell Road, Barrow-in-furness LA14 3UZ
| Today | See what it's worth now |
| 3 Feb 2026 | £150,000 |
| 6 Nov 2020 | £116,250 |
30, Gatacre Street, Barrow-in-furness LA14 3PY
| Today | See what it's worth now |
| 3 Feb 2026 | £110,000 |
| 14 Sep 2020 | £78,000 |
35, Jason Street, Barrow-in-furness LA14 3EJ
| Today | See what it's worth now |
| 30 Jan 2026 | £182,000 |
| 10 Jan 2023 | £155,000 |
74, Plymouth Street, Barrow-in-furness LA14 3AL
| Today | See what it's worth now |
| 30 Jan 2026 | £251,500 |
| 26 Nov 2012 | £97,500 |
No other historical records.
1, Combe View, Barrow-in-furness LA14 3TA
| Today | See what it's worth now |
| 28 Jan 2026 | £210,000 |
| 23 Aug 2024 | £181,500 |
2, Cumbria View, Walney, Barrow-in-furness LA14 3HP
| Today | See what it's worth now |
| 27 Jan 2026 | £195,000 |
No other historical records.
95, West Shore Road, Barrow-in-furness LA14 3TZ
| Today | See what it's worth now |
| 23 Jan 2026 | £220,000 |
| 20 Jan 2020 | £125,000 |
24, Cows Tarn Lane, Barrow-in-furness LA14 3UG
| Today | See what it's worth now |
| 21 Jan 2026 | £132,000 |
| 22 May 2009 | £94,950 |
11, Niger Street, Barrow-in-furness LA14 3EH
| Today | See what it's worth now |
| 15 Jan 2026 | £147,000 |
| 23 May 2024 | £125,000 |
97, Central Drive, Barrow-in-furness LA14 3HZ
| Today | See what it's worth now |
| 8 Jan 2026 | £360,000 |
| 3 Nov 2017 | £300,000 |
No other historical records.
67, Black Butts Lane, Barrow-in-furness LA14 3JZ
| Today | See what it's worth now |
| 8 Jan 2026 | £290,000 |
| 9 Sep 2016 | £162,000 |
132, Mill Lane, Walney, Barrow-in-furness LA14 3NT
| Today | See what it's worth now |
| 5 Jan 2026 | £120,000 |
No other historical records.
Source Acknowledgement: © Crown copyright. England and Wales house price data is publicly available information produced by the HM Land Registry.This material was last updated on 15 May 2026. It covers the period from 1 January 1995 to 31 March 2026 and contains property transactions which have been registered during that period. Contains HM Land Registry data © Crown copyright and database right 2026. This data is licensed under the Open Government Licence v3.0.
Disclaimer: Rightmove.co.uk provides this HM Land Registry data "as is". The burden for fitness of the data relies completely with the user and is provided for informational purposes only. No warranty, express or implied, is given relating to the accuracy of content of the HM Land Registry data and Rightmove does not accept any liability for error or omission. If you have found an error with the data or need further information please contact HM Land Registry.
Permitted Use: Viewers of this Information are granted permission to access this Crown copyright material and to download it onto electronic, magnetic, optical or similar storage media provided that such activities are for private research, study or in-house use only. Any other use of the material requires the formal written permission of Land Registry which can be requested from us, and is subject to an additional licence and associated charge.
Map data ©OpenStreetMap contributors.
Rightmove takes no liability for your use of, or reliance on, Rightmove's Instant Valuation due to the limitations of our tracking tool listed here. Use of this tool is taken entirely at your own risk. All rights reserved.