
House Prices in Billington
House prices in Billington have an overall average of £260,706 over the last year.
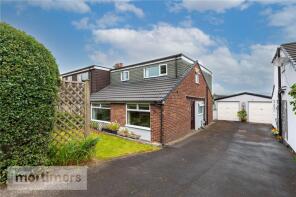
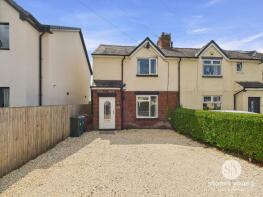
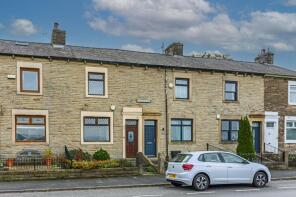
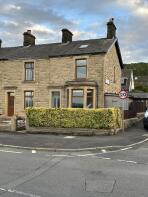
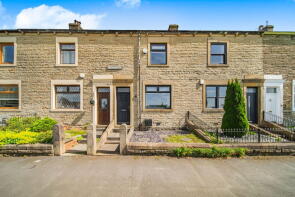
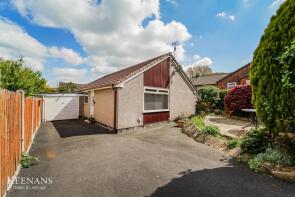
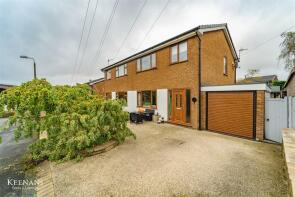
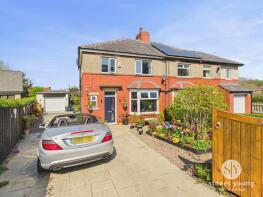
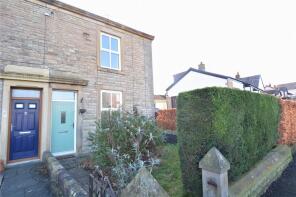
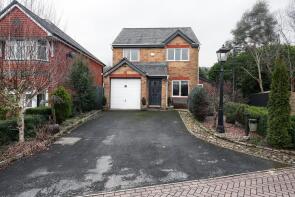
The majority of properties sold in Billington during the last year were terraced properties, selling for an average price of £226,375. Semi-detached properties sold for an average of £265,582, with detached properties fetching £342,500.
Overall, the historical sold prices in Billington over the last year were 14% down on the previous year and 1% down on the 2023 peak of £263,926.
Properties Sold
26, Pasturelands Drive, Clitheroe BB7 9LW
| Today | See what it's worth now |
| 10 Apr 2026 | £267,000 |
| 10 Feb 2006 | £185,000 |
No other historical records.
7, Bank Cottages, Whalley Road, Clitheroe BB7 9NL
| Today | See what it's worth now |
| 20 Mar 2026 | £240,000 |
| 11 Feb 2005 | £80,000 |
8, Bonny Grass Terrace, Whalley Road, Clitheroe BB7 9LY
| Today | See what it's worth now |
| 6 Mar 2026 | £210,000 |
| 23 Apr 2018 | £148,000 |
12, The Meadows, Clitheroe BB7 9LE
| Today | See what it's worth now |
| 5 Mar 2026 | £260,000 |
| 11 Oct 2019 | £175,000 |
No other historical records.
29, Calder Avenue, Clitheroe BB7 9NQ
| Today | See what it's worth now |
| 30 Jan 2026 | £225,000 |
| 1 Aug 2014 | £145,000 |
No other historical records.
3, West View Terrace, Whalley Road, Clitheroe BB7 9LT
| Today | See what it's worth now |
| 30 Jan 2026 | £175,000 |
| 29 Aug 2008 | £135,000 |
13, Fells View, Whalley Road, Clitheroe BB7 9LR
| Today | See what it's worth now |
| 29 Jan 2026 | £283,000 |
| 1 May 1997 | £42,500 |
4, West View Terrace, Whalley Road, Clitheroe BB7 9LT
| Today | See what it's worth now |
| 12 Jan 2026 | £210,000 |
| 31 Aug 2018 | £125,000 |
No other historical records.
9, Lakeland Close, Clitheroe BB7 9LN
| Today | See what it's worth now |
| 26 Nov 2025 | £240,000 |
| 12 Sep 2000 | £75,500 |
No other historical records.
11, Walmsley Brow, Clitheroe BB7 9TT
| Today | See what it's worth now |
| 17 Oct 2025 | £267,000 |
| 11 Nov 2022 | £265,000 |
No other historical records.
Standridge, Whalley Road, Clitheroe BB7 9NA
| Today | See what it's worth now |
| 17 Oct 2025 | £295,000 |
| 20 Oct 1998 | £84,000 |
No other historical records.
1, West View Terrace, Whalley Road, Clitheroe BB7 9LT

| Today | See what it's worth now |
| 10 Oct 2025 | £215,000 |
| 20 Nov 2018 | £172,500 |
42, Pasturelands Drive, Billington BB7 9LW
| Today | See what it's worth now |
| 19 Sep 2025 | £289,995 |
No other historical records.
6, Abbey Terrace, Whalley Road, Clitheroe BB7 9LQ
| Today | See what it's worth now |
| 4 Sep 2025 | £218,000 |
| 16 Sep 2022 | £196,000 |
12, Dale View, Billington BB7 9LL
| Today | See what it's worth now |
| 13 Aug 2025 | £315,000 |
| 20 Jul 2001 | £112,000 |
4, Spinners Vale, Billington BB7 9GL
| Today | See what it's worth now |
| 25 Jul 2025 | £472,500 |
No other historical records.
20, Dale View, Clitheroe BB7 9LL
| Today | See what it's worth now |
| 23 Jul 2025 | £249,500 |
| 24 Oct 2018 | £184,000 |
No other historical records.
Thornlee, Whalley Road, Billington BB7 9LG
| Today | See what it's worth now |
| 20 Jun 2025 | £280,000 |
No other historical records.
14, Painter Crescent, Clitheroe BB7 9XN
| Today | See what it's worth now |
| 30 May 2025 | £450,000 |
| 22 Nov 2019 | £355,000 |
15, Painter Wood, Whalley Old Road, Clitheroe BB7 9JD
| Today | See what it's worth now |
| 30 May 2025 | £140,000 |
| 21 Dec 2007 | £136,500 |
18, Billington Gardens, Clitheroe BB7 9LU

| Today | See what it's worth now |
| 2 May 2025 | £217,000 |
| 14 Apr 2016 | £157,500 |
2, Elker Mews, Clitheroe BB7 9NF
| Today | See what it's worth now |
| 25 Apr 2025 | £274,999 |
| 1 Nov 2023 | £265,000 |
7, Painter Wood, Whalley Old Road, Clitheroe BB7 9JD
| Today | See what it's worth now |
| 24 Apr 2025 | £310,000 |
| 9 Aug 2013 | £235,000 |
Source Acknowledgement: © Crown copyright. England and Wales house price data is publicly available information produced by the HM Land Registry.This material was last updated on 9 July 2026. It covers the period from 1 January 1995 to 30 April 2026 and contains property transactions which have been registered during that period. Contains HM Land Registry data © Crown copyright and database right 2026. This data is licensed under the Open Government Licence v3.0.
Disclaimer: Rightmove.co.uk provides this HM Land Registry data "as is". The burden for fitness of the data relies completely with the user and is provided for informational purposes only. No warranty, express or implied, is given relating to the accuracy of content of the HM Land Registry data and Rightmove does not accept any liability for error or omission. If you have found an error with the data or need further information please contact HM Land Registry.
Permitted Use: Viewers of this Information are granted permission to access this Crown copyright material and to download it onto electronic, magnetic, optical or similar storage media provided that such activities are for private research, study or in-house use only. Any other use of the material requires the formal written permission of Land Registry which can be requested from us, and is subject to an additional licence and associated charge.
Rightmove takes no liability for your use of, or reliance on, Rightmove's Instant Valuation due to the limitations of our tracking tool listed here. Use of this tool is taken entirely at your own risk. All rights reserved.