
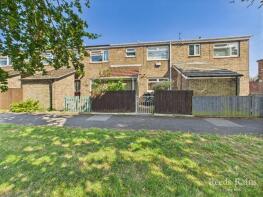
House Prices in Bilton Grange
House prices in Bilton Grange have an overall average of £122,590 over the last year.
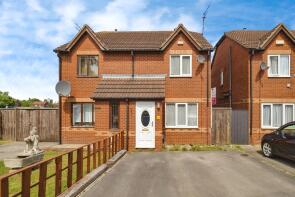
The majority of properties sold in Bilton Grange during the last year were semi-detached properties, selling for an average price of £131,493. Terraced properties sold for an average of £111,906.
Overall, the historical sold prices in Bilton Grange over the last year were 5% down on the previous year and 4% down on the 2022 peak of £127,522.
Properties Sold
14, Camperdown, Hull HU11 4BU

| Today | See what it's worth now |
| 24 Apr 2026 | £130,000 |
| 10 Nov 1995 | £45,500 |
No other historical records.
102, Milne Road, Hull HU9 4UN
| Today | See what it's worth now |
| 27 Mar 2026 | £139,995 |
| 23 Apr 2021 | £114,000 |
1, Bainbridge Avenue, Hull HU9 5BN
| Today | See what it's worth now |
| 25 Mar 2026 | £117,000 |
| 29 Aug 2018 | £84,950 |
No other historical records.
1, Rolston Close, Hull HU9 5AF
| Today | See what it's worth now |
| 13 Mar 2026 | £130,000 |
| 11 Mar 2022 | £125,000 |
23, Barham Road, Kingston Upon Hull HU9 4TX
| Today | See what it's worth now |
| 12 Mar 2026 | £75,000 |
No other historical records.
154, Staveley Road, Hull HU9 4ST
| Today | See what it's worth now |
| 27 Feb 2026 | £121,000 |
| 17 Sep 2021 | £92,550 |
No other historical records.
50, Winchester Close, Hull HU9 4TT
| Today | See what it's worth now |
| 6 Feb 2026 | £150,000 |
| 14 Mar 2008 | £112,000 |
No other historical records.
244, Amethyst Road, Hull HU9 4DJ
| Today | See what it's worth now |
| 30 Jan 2026 | £127,000 |
| 17 Feb 2023 | £95,000 |
35, Winchester Avenue, Hull HU9 4TU

| Today | See what it's worth now |
| 23 Jan 2026 | £160,000 |
| 9 Sep 2011 | £123,950 |
No other historical records.
219, Staveley Road, Hull HU9 4UP
| Today | See what it's worth now |
| 9 Jan 2026 | £165,000 |
| 31 Mar 2021 | £135,000 |
267, Barham Road, Hull HU9 4EJ
| Today | See what it's worth now |
| 22 Dec 2025 | £111,000 |
| 18 May 2018 | £80,000 |
4, Waudby Way, Hull HU9 4DF
| Today | See what it's worth now |
| 18 Dec 2025 | £140,000 |
| 25 Jun 2021 | £132,995 |
No other historical records.
53, Bradford Avenue, Hull HU9 4NJ
| Today | See what it's worth now |
| 18 Dec 2025 | £160,000 |
| 30 Nov 2023 | £160,000 |
6, Nestor Grove, Kingston Upon Hull HU9 4DB
| Today | See what it's worth now |
| 17 Dec 2025 | £110,000 |
No other historical records.
121, Greenwich Avenue, Hull HU9 4XA

| Today | See what it's worth now |
| 15 Dec 2025 | £104,000 |
| 14 Oct 2002 | £11,730 |
No other historical records.
67, Greenwich Avenue, Hull HU9 4XA
| Today | See what it's worth now |
| 12 Dec 2025 | £97,000 |
| 6 Nov 2023 | £91,000 |
No other historical records.
15, Grange Road, Hull HU9 4LQ
| Today | See what it's worth now |
| 11 Dec 2025 | £105,000 |
| 24 Mar 2021 | £80,000 |
64, Bexhill Avenue, Kingston Upon Hull HU9 4LR
| Today | See what it's worth now |
| 8 Dec 2025 | £67,500 |
No other historical records.
10, Charterfield, Hull HU11 4BY
| Today | See what it's worth now |
| 3 Dec 2025 | £195,000 |
| 23 Mar 2012 | £133,000 |
307, Hopewell Road, Hull HU9 4HQ
| Today | See what it's worth now |
| 1 Dec 2025 | £86,600 |
| 3 Jul 2017 | £65,000 |
51, Wivern Road, Hull HU9 4HR
| Today | See what it's worth now |
| 28 Nov 2025 | £122,500 |
| 18 Jun 2018 | £72,500 |
No other historical records.
143, Hermes Close, Hull HU9 4DR
| Today | See what it's worth now |
| 21 Nov 2025 | £122,500 |
| 31 Oct 1996 | £28,500 |
No other historical records.
14, Watson Avenue, Hull HU9 4RJ
| Today | See what it's worth now |
| 18 Nov 2025 | £110,000 |
| 22 Feb 2008 | £58,750 |
No other historical records.
Source Acknowledgement: © Crown copyright. England and Wales house price data is publicly available information produced by the HM Land Registry.This material was last updated on 9 July 2026. It covers the period from 1 January 1995 to 30 April 2026 and contains property transactions which have been registered during that period. Contains HM Land Registry data © Crown copyright and database right 2026. This data is licensed under the Open Government Licence v3.0.
Disclaimer: Rightmove.co.uk provides this HM Land Registry data "as is". The burden for fitness of the data relies completely with the user and is provided for informational purposes only. No warranty, express or implied, is given relating to the accuracy of content of the HM Land Registry data and Rightmove does not accept any liability for error or omission. If you have found an error with the data or need further information please contact HM Land Registry.
Permitted Use: Viewers of this Information are granted permission to access this Crown copyright material and to download it onto electronic, magnetic, optical or similar storage media provided that such activities are for private research, study or in-house use only. Any other use of the material requires the formal written permission of Land Registry which can be requested from us, and is subject to an additional licence and associated charge.
Rightmove takes no liability for your use of, or reliance on, Rightmove's Instant Valuation due to the limitations of our tracking tool listed here. Use of this tool is taken entirely at your own risk. All rights reserved.