
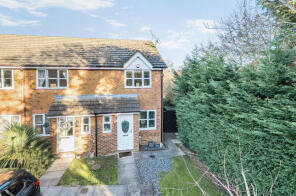
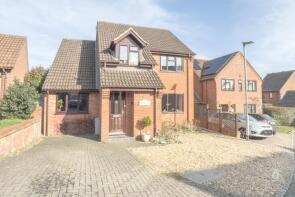
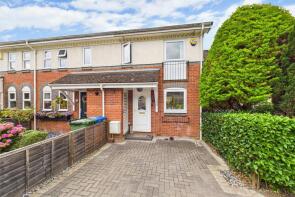
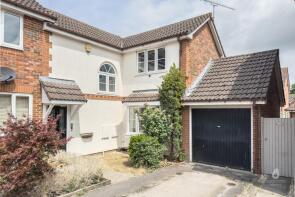
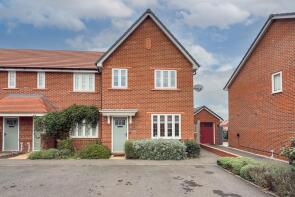
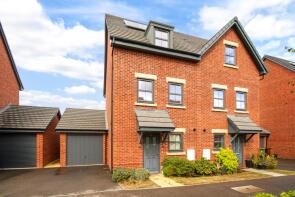
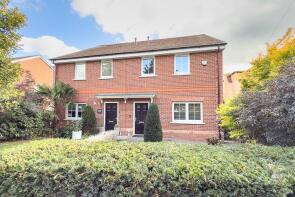
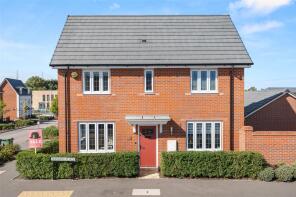
House Prices in Binfield
House prices in Binfield have an overall average of £513,048 over the last year.
The majority of properties sold in Binfield during the last year were detached properties, selling for an average price of £698,707. Flats sold for an average of £269,771, with semi-detached properties fetching £499,122.
Overall, the historical sold prices in Binfield over the last year were similar to the previous year and 6% down on the 2022 peak of £547,059.
Properties Sold
81, Benetfeld Road, Binfield, Bracknell RG42 4EW
| Today | See what it's worth now |
| 23 Apr 2026 | £715,000 |
| 22 Apr 1996 | £118,000 |
No other historical records.
35, Bryan Gardens, Binfield, Bracknell RG42 4JQ

| Today | See what it's worth now |
| 20 Apr 2026 | £565,000 |
| 2 Oct 2020 | £490,000 |
No other historical records.
Keildon, Beehive Road, Binfield, Bracknell RG12 8TR
| Today | See what it's worth now |
| 10 Apr 2026 | £590,000 |
| 22 Apr 2013 | £340,000 |
No other historical records.
47, St Georges Park, Binfield, Bracknell RG42 4JG
| Today | See what it's worth now |
| 31 Mar 2026 | £490,000 |
| 28 Jun 2022 | £495,000 |
No other historical records.
Terrace House, Terrace Road North, Binfield, Bracknell RG42 5JA

| Today | See what it's worth now |
| 27 Mar 2026 | £525,000 |
| 24 Sep 2001 | £215,000 |
No other historical records.
11, Wilstrode Avenue, Binfield, Bracknell RG42 4UW
| Today | See what it's worth now |
| 26 Mar 2026 | £600,000 |
| 19 Jul 1996 | £132,950 |
No other historical records.
56, Dunford Place, Binfield, Bracknell RG42 4UQ
| Today | See what it's worth now |
| 26 Mar 2026 | £390,000 |
| 24 Aug 2020 | £315,000 |
6 Collscot, Emmets Nest, Binfield, Bracknell RG42 4HH
| Today | See what it's worth now |
| 23 Mar 2026 | £625,000 |
| 21 Apr 2022 | £625,000 |
9, Hombrook Drive, Binfield, Bracknell RG42 1PT
| Today | See what it's worth now |
| 23 Mar 2026 | £350,000 |
| 18 Nov 2020 | £299,000 |
3, Park Lane, Binfield, Bracknell RG42 4UL
| Today | See what it's worth now |
| 23 Mar 2026 | £470,000 |
| 23 Aug 2019 | £415,000 |
25, Porthcawl Drive, Binfield, Bracknell RG42 4JH
| Today | See what it's worth now |
| 19 Mar 2026 | £460,000 |
| 31 Jul 2020 | £400,000 |
No other historical records.
40, Blamire Drive, Binfield, Bracknell RG42 4UN

| Today | See what it's worth now |
| 19 Mar 2026 | £711,000 |
| 24 May 2013 | £447,500 |
8, Popeswood Manor, Popeswood Road, Binfield, Bracknell RG42 4GR
| Today | See what it's worth now |
| 16 Mar 2026 | £365,000 |
| 6 Mar 2019 | £320,000 |
No other historical records.
16, Russell Chase, Binfield, Bracknell RG42 4FZ
| Today | See what it's worth now |
| 13 Mar 2026 | £490,000 |
| 14 May 2021 | £464,200 |
No other historical records.
3, Foxley Court, Benetfeld Road, Binfield, Bracknell RG42 4JZ
| Today | See what it's worth now |
| 12 Mar 2026 | £260,000 |
| 20 Sep 2001 | £142,000 |
No other historical records.
11, Culvercroft, Binfield, Bracknell RG42 4DF
| Today | See what it's worth now |
| 6 Mar 2026 | £530,000 |
| 24 Jun 2008 | £295,000 |
22, Stevenson Drive, Binfield, Bracknell RG42 5TB

| Today | See what it's worth now |
| 19 Feb 2026 | £442,000 |
| 28 Feb 2025 | £340,000 |
9, Milward Gardens, Binfield, Bracknell RG12 8FH
| Today | See what it's worth now |
| 13 Feb 2026 | £260,000 |
| 5 Aug 2010 | £155,000 |
3, Hillside Drive, Binfield, Bracknell RG42 4HG

| Today | See what it's worth now |
| 12 Feb 2026 | £635,000 |
| 15 Dec 2000 | £163,000 |
No other historical records.
19, Crockford Place, Binfield, Bracknell RG42 4UT
| Today | See what it's worth now |
| 10 Feb 2026 | £497,500 |
| 12 May 2023 | £475,000 |
Applegarth House, Terrace Road North, Binfield, Bracknell RG42 5JJ
| Today | See what it's worth now |
| 9 Feb 2026 | £1,200,000 |
| 16 Jan 2023 | £1,065,000 |
6, Laureates Place, Binfield, Bracknell RG42 4FL
| Today | See what it's worth now |
| 9 Feb 2026 | £560,000 |
| 7 Aug 2017 | £545,000 |
No other historical records.
Lawton House, London Road, Binfield, Bracknell RG42 4AA
| Today | See what it's worth now |
| 23 Jan 2026 | £567,000 |
| 8 Jan 2018 | £545,000 |
No other historical records.
Source Acknowledgement: © Crown copyright. England and Wales house price data is publicly available information produced by the HM Land Registry.This material was last updated on 9 July 2026. It covers the period from 1 January 1995 to 30 April 2026 and contains property transactions which have been registered during that period. Contains HM Land Registry data © Crown copyright and database right 2026. This data is licensed under the Open Government Licence v3.0.
Disclaimer: Rightmove.co.uk provides this HM Land Registry data "as is". The burden for fitness of the data relies completely with the user and is provided for informational purposes only. No warranty, express or implied, is given relating to the accuracy of content of the HM Land Registry data and Rightmove does not accept any liability for error or omission. If you have found an error with the data or need further information please contact HM Land Registry.
Permitted Use: Viewers of this Information are granted permission to access this Crown copyright material and to download it onto electronic, magnetic, optical or similar storage media provided that such activities are for private research, study or in-house use only. Any other use of the material requires the formal written permission of Land Registry which can be requested from us, and is subject to an additional licence and associated charge.
Rightmove takes no liability for your use of, or reliance on, Rightmove's Instant Valuation due to the limitations of our tracking tool listed here. Use of this tool is taken entirely at your own risk. All rights reserved.