
House Prices in Birch Hill
House prices in Birch Hill have an overall average of £355,685 over the last year.
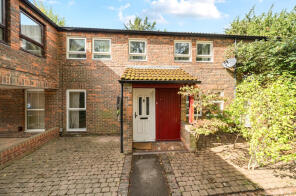
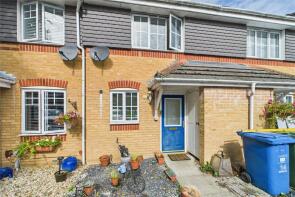
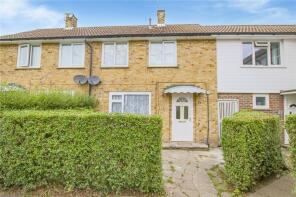
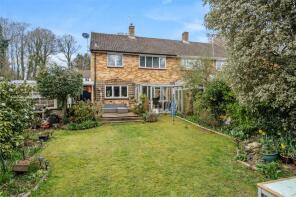
The majority of properties sold in Birch Hill during the last year were terraced properties, selling for an average price of £371,053. Flats sold for an average of £218,272, with semi-detached properties fetching £427,104.
Overall, the historical sold prices in Birch Hill over the last year were 1% down on the previous year and 3% up on the 2022 peak of £344,295.
Properties Sold
33, Jevington, Bracknell RG12 7ZD
| Today | See what it's worth now |
| 13 Mar 2026 | £345,000 |
| 18 Dec 2009 | £170,000 |
14, Hopper Vale, Bracknell RG12 7GH
| Today | See what it's worth now |
| 6 Mar 2026 | £325,000 |
| 21 Dec 2015 | £273,000 |
17, Pond Moor Road, Bracknell RG12 7JL
| Today | See what it's worth now |
| 6 Mar 2026 | £355,000 |
| 29 Apr 2005 | £152,500 |
16, Dundas Close, Bracknell RG12 7BX
| Today | See what it's worth now |
| 6 Mar 2026 | £505,000 |
| 30 Sep 2003 | £229,950 |
10, Temple Moore House, Liscombe, Bracknell RG12 7DE
| Today | See what it's worth now |
| 3 Mar 2026 | £165,000 |
| 30 Mar 2016 | £170,000 |
No other historical records.
64, Ladybank, Bracknell RG12 7HB
| Today | See what it's worth now |
| 2 Mar 2026 | £205,000 |
| 16 Dec 2014 | £177,000 |
38, Claverdon, Bracknell RG12 7YN
| Today | See what it's worth now |
| 2 Mar 2026 | £370,000 |
| 20 Aug 2021 | £319,000 |
No other historical records.
56, Haversham Drive, Bracknell RG12 7NB

| Today | See what it's worth now |
| 27 Feb 2026 | £370,500 |
| 24 May 2019 | £290,000 |
42, Haversham Drive, Bracknell RG12 7NB
| Today | See what it's worth now |
| 27 Feb 2026 | £348,000 |
| 5 Aug 2014 | £250,000 |
35, Pendlebury, Bracknell RG12 7RB
| Today | See what it's worth now |
| 26 Feb 2026 | £375,000 |
| 10 Oct 2014 | £250,000 |
3, Cottesmore, Bracknell RG12 7YL
| Today | See what it's worth now |
| 26 Feb 2026 | £250,000 |
| 5 Aug 2016 | £205,000 |
26, Claverdon, Bracknell RG12 7YN
| Today | See what it's worth now |
| 23 Feb 2026 | £360,000 |
| 11 Jul 2018 | £290,000 |
12, Lydney, Bracknell RG12 7LQ
| Today | See what it's worth now |
| 23 Feb 2026 | £340,000 |
| 19 Jan 2010 | £205,000 |
9, Manston Drive, Bracknell RG12 7PH
| Today | See what it's worth now |
| 20 Feb 2026 | £355,000 |
| 28 Jul 1995 | £52,500 |
No other historical records.
20, Brunswick, Bracknell RG12 7YY

| Today | See what it's worth now |
| 19 Feb 2026 | £445,000 |
| 28 Feb 2018 | £375,000 |
No other historical records.
17, Attebrouche Court, Bracknell RG12 7FD
| Today | See what it's worth now |
| 17 Feb 2026 | £350,000 |
| 12 Feb 2013 | £190,000 |
63, Lochinver, Bracknell RG12 7LD
| Today | See what it's worth now |
| 13 Feb 2026 | £200,000 |
| 30 Nov 2007 | £146,000 |
1, Fitzroy Close, Bracknell RG12 7GP
| Today | See what it's worth now |
| 12 Feb 2026 | £390,000 |
| 18 Mar 2005 | £230,000 |
45, Gainsborough, Bracknell RG12 7WL
| Today | See what it's worth now |
| 6 Feb 2026 | £425,000 |
| 18 Dec 1997 | £111,500 |
No other historical records.
71, Naseby, Bracknell RG12 7HD

| Today | See what it's worth now |
| 2 Feb 2026 | £400,000 |
| 4 Nov 2016 | £292,500 |
78, Cottesmore, Bracknell RG12 7YP

| Today | See what it's worth now |
| 30 Jan 2026 | £368,000 |
| 16 Jul 2004 | £147,000 |
No other historical records.
52, Bywood, Bracknell RG12 7RF
| Today | See what it's worth now |
| 29 Jan 2026 | £418,000 |
| 21 Jun 2004 | £155,000 |
No other historical records.
44, Bishopdale, Bracknell RG12 7RZ
| Today | See what it's worth now |
| 29 Jan 2026 | £304,000 |
| 13 Mar 2017 | £280,000 |
29, Fitzroy Close, Bracknell RG12 7GP
| Today | See what it's worth now |
| 20 Jan 2026 | £445,000 |
| 5 Mar 2021 | £350,000 |
3, Juniper, Bracknell RG12 7ZG
| Today | See what it's worth now |
| 19 Jan 2026 | £270,000 |
| 24 Mar 1995 | £54,500 |
No other historical records.
Source Acknowledgement: © Crown copyright. England and Wales house price data is publicly available information produced by the HM Land Registry.This material was last updated on 15 May 2026. It covers the period from 1 January 1995 to 31 March 2026 and contains property transactions which have been registered during that period. Contains HM Land Registry data © Crown copyright and database right 2026. This data is licensed under the Open Government Licence v3.0.
Disclaimer: Rightmove.co.uk provides this HM Land Registry data "as is". The burden for fitness of the data relies completely with the user and is provided for informational purposes only. No warranty, express or implied, is given relating to the accuracy of content of the HM Land Registry data and Rightmove does not accept any liability for error or omission. If you have found an error with the data or need further information please contact HM Land Registry.
Permitted Use: Viewers of this Information are granted permission to access this Crown copyright material and to download it onto electronic, magnetic, optical or similar storage media provided that such activities are for private research, study or in-house use only. Any other use of the material requires the formal written permission of Land Registry which can be requested from us, and is subject to an additional licence and associated charge.
Map data ©OpenStreetMap contributors.
Rightmove takes no liability for your use of, or reliance on, Rightmove's Instant Valuation due to the limitations of our tracking tool listed here. Use of this tool is taken entirely at your own risk. All rights reserved.