
House Prices in Birley
House prices in Birley have an overall average of £357,217 over the last year.
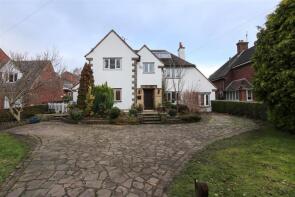
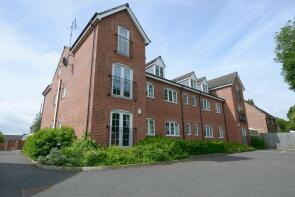
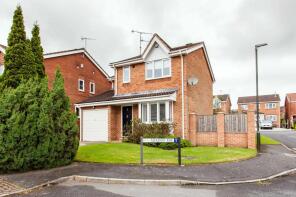
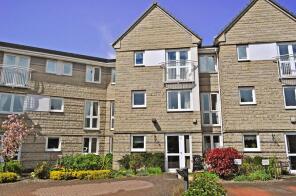
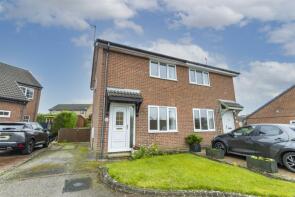
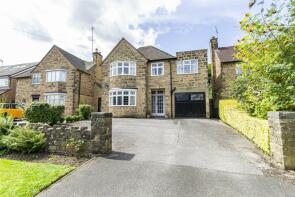
The majority of properties sold in Birley during the last year were detached properties, selling for an average price of £439,762. Semi-detached properties sold for an average of £280,986, with flats fetching £190,300.
Overall, the historical sold prices in Birley over the last year were 4% up on the previous year and 8% down on the 2022 peak of £386,639.
Properties Sold
12, Cornfield Close, Holme Hall, Chesterfield S42 7JU
| Today | See what it's worth now |
| 30 May 2025 | £245,000 |
| 18 Dec 2023 | £230,000 |
186, Somersall Lane, Chesterfield S40 3NA
| Today | See what it's worth now |
| 23 May 2025 | £540,000 |
| 23 Jan 2009 | £300,000 |
No other historical records.
Green Acres, Matlock Road, Chesterfield S42 7LD


| Today | See what it's worth now |
| 22 May 2025 | £1,150,000 |
| 12 Mar 2001 | £125,000 |
31, Yew Tree Drive, Chesterfield S40 3NB

| Today | See what it's worth now |
| 22 May 2025 | £870,000 |
| 15 Jul 2011 | £475,000 |
No other historical records.
26, Pennywell Drive, Chesterfield S42 7EY
| Today | See what it's worth now |
| 16 May 2025 | £335,000 |
| 3 Jul 2009 | £175,000 |
No other historical records.
7, Abbeyhill Close, Holme Hall, Chesterfield S42 7JL
| Today | See what it's worth now |
| 8 May 2025 | £317,000 |
| 28 Apr 2023 | £300,000 |
No other historical records.
667 Westways, Chatsworth Road, Chesterfield S40 3PA
| Today | See what it's worth now |
| 6 May 2025 | £700,000 |
| 16 Mar 2020 | £570,000 |
7, Princeton House, Old Pheasant Court, Chesterfield S40 3GW
| Today | See what it's worth now |
| 23 Apr 2025 | £126,500 |
| 30 Jun 2016 | £137,500 |
2, Meadow Rise, Holme Hall, Chesterfield S42 7PX
| Today | See what it's worth now |
| 23 Apr 2025 | £358,000 |
| 30 Nov 2015 | £180,000 |
8, Stephenson Court, Chatsworth Road, Chesterfield S40 3JW
| Today | See what it's worth now |
| 17 Apr 2025 | £152,500 |
| 19 Sep 2024 | £145,000 |
15, Creswick Close, Chesterfield S40 3PX
| Today | See what it's worth now |
| 16 Apr 2025 | £195,000 |
| 10 Aug 2006 | £140,000 |
No other historical records.
45, Acorn Ridge, Chesterfield S42 7HF
| Today | See what it's worth now |
| 31 Mar 2025 | £410,000 |
| 27 Jul 2011 | £240,000 |
No other historical records.
29, Brookside Glen, Chesterfield S40 3PG
| Today | See what it's worth now |
| 31 Mar 2025 | £460,000 |
No other historical records.
61, Somersby Avenue, Chesterfield S42 7LY
| Today | See what it's worth now |
| 31 Mar 2025 | £340,000 |
| 20 Jun 2014 | £243,000 |
No other historical records.
Foxglove Cottage, Main Road, Chesterfield S42 7BX
| Today | See what it's worth now |
| 19 Mar 2025 | £625,000 |
| 20 Sep 2000 | £190,000 |
No other historical records.
7, Easedale Close, Holme Hall, Chesterfield S40 4XP
| Today | See what it's worth now |
| 17 Mar 2025 | £165,000 |
| 30 Jan 2004 | £88,000 |
60, Somersby Avenue, Chesterfield S42 7LY
| Today | See what it's worth now |
| 14 Mar 2025 | £197,000 |
| 18 Jan 2022 | £200,000 |
27, Hoylake Avenue, Chesterfield S40 3NQ
| Today | See what it's worth now |
| 12 Mar 2025 | £349,000 |
| 1 Dec 2017 | £249,000 |
54, Yew Tree Drive, Chesterfield S40 3NB
| Today | See what it's worth now |
| 12 Mar 2025 | £75,000 |
| 16 Jul 2019 | £257,000 |
7, Pennywell Drive, Chesterfield S42 7EZ
| Today | See what it's worth now |
| 12 Mar 2025 | £265,000 |
| 9 Mar 2000 | £85,000 |
No other historical records.
4, Hoylake Avenue, Chesterfield S40 3NQ
| Today | See what it's worth now |
| 10 Mar 2025 | £302,500 |
| 12 Mar 2020 | £300,000 |
11, The Meadows, Holme Hall, Chesterfield S42 7JY
| Today | See what it's worth now |
| 10 Mar 2025 | £320,000 |
| 26 Feb 1999 | £85,000 |
No other historical records.
2, Somersall Park Road, Chesterfield S40 3LD
| Today | See what it's worth now |
| 7 Mar 2025 | £355,000 |
| 20 Jul 2020 | £290,000 |
2, Old Pheasant Court, Chesterfield S40 3GY
| Today | See what it's worth now |
| 7 Mar 2025 | £475,000 |
| 26 Jul 2022 | £530,000 |
50, Firvale Road, Chesterfield S42 7NN
| Today | See what it's worth now |
| 3 Mar 2025 | £250,000 |
| 4 Apr 1997 | £47,000 |
No other historical records.
Get ready with a Mortgage in Principle
- Personalised result in just 20 minutes
- Find out how much you can borrow
- Get viewings faster with agents
- No impact on your credit score
What's your property worth?
Source Acknowledgement: © Crown copyright. England and Wales house price data is publicly available information produced by the HM Land Registry.This material was last updated on 6 August 2025. It covers the period from 1 January 1995 to 30 June 2025 and contains property transactions which have been registered during that period. Contains HM Land Registry data © Crown copyright and database right 2025. This data is licensed under the Open Government Licence v3.0.
Disclaimer: Rightmove.co.uk provides this HM Land Registry data "as is". The burden for fitness of the data relies completely with the user and is provided for informational purposes only. No warranty, express or implied, is given relating to the accuracy of content of the HM Land Registry data and Rightmove does not accept any liability for error or omission. If you have found an error with the data or need further information please contact HM Land Registry.
Permitted Use: Viewers of this Information are granted permission to access this Crown copyright material and to download it onto electronic, magnetic, optical or similar storage media provided that such activities are for private research, study or in-house use only. Any other use of the material requires the formal written permission of Land Registry which can be requested from us, and is subject to an additional licence and associated charge.
Map data ©OpenStreetMap contributors.
Rightmove takes no liability for your use of, or reliance on, Rightmove's Instant Valuation due to the limitations of our tracking tool listed here. Use of this tool is taken entirely at your own risk. All rights reserved.