
House Prices in Blackburn
House prices in Blackburn have an overall average of £179,548 over the last year.
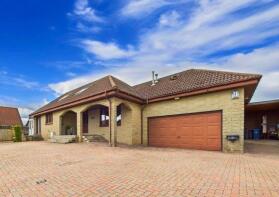
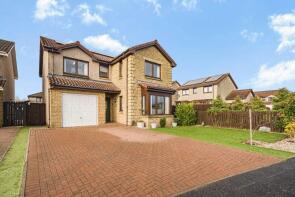
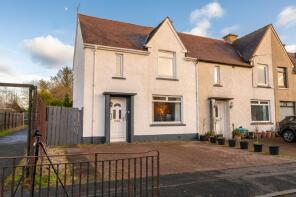
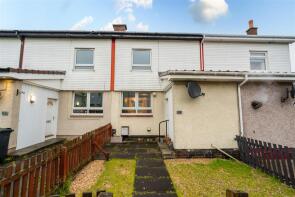
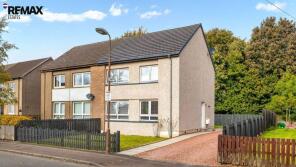
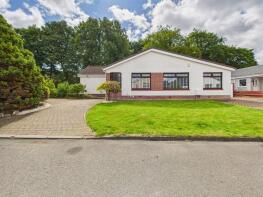
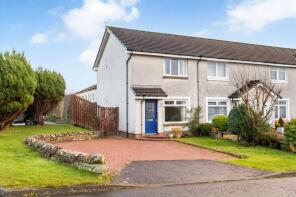
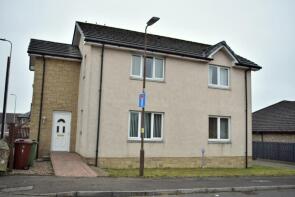
The majority of properties sold in Blackburn during the last year were detached properties, selling for an average price of £270,648. Terraced properties sold for an average of £141,506, with semi-detached properties fetching £163,938.
Overall, the historical sold prices in Blackburn over the last year were 19% up on the previous year and similar to the 2023 peak of £179,515.
Properties Sold
11, Mill Road, Bathgate EH47 7JZ

| Today | See what it's worth now |
| 28 Apr 2026 | £280,000 |
| 18 Jan 2010 | £195,000 |
No other historical records.
2, Neilson Court, Bathgate EH47 7NA
| Today | See what it's worth now |
| 27 Apr 2026 | £350,000 |
| 10 Jun 2005 | £195,000 |
No other historical records.
11, Pinewood Place, Bathgate EH47 7NX
| Today | See what it's worth now |
| 24 Apr 2026 | £320,000 |
| 11 Mar 2014 | £182,000 |
198, Riddochhill Road, Bathgate EH47 7HA
| Today | See what it's worth now |
| 24 Apr 2026 | £173,500 |
| 29 May 2017 | £110,000 |
150, Rowan Drive, Bathgate EH47 7NT
| Today | See what it's worth now |
| 20 Apr 2026 | £117,000 |
| 18 Mar 2024 | £102,000 |
24 Helenslea Cottages, Bathgate Road, Bathgate EH47 7LW
| Today | See what it's worth now |
| 15 Apr 2026 | £161,157 |
| 21 Sep 2018 | £125,027 |
59, Rowan Street, Bathgate EH47 7DZ
| Today | See what it's worth now |
| 8 Apr 2026 | £133,000 |
| 2 Apr 2019 | £108,700 |
9, Beechwood Gardens, Bathgate EH47 7PS
| Today | See what it's worth now |
| 31 Mar 2026 | £200,000 |
| 7 Oct 2016 | £165,000 |
No other historical records.
6a, Neilson Court, Bathgate EH47 7NA
| Today | See what it's worth now |
| 9 Mar 2026 | £73,000 |
| 22 Oct 2018 | £66,595 |
7, Riddochhill Court, Bathgate EH47 7JB

| Today | See what it's worth now |
| 2 Mar 2026 | £190,000 |
| 21 May 2021 | £170,000 |
6e, Neilson Court, Blackburn EH47 7NA
| Today | See what it's worth now |
| 24 Feb 2026 | £90,000 |
| 25 Jul 2023 | £75,000 |
No other historical records.
1, Quoiters Court, Blackburn EH47 7PP
| Today | See what it's worth now |
| 20 Feb 2026 | £175,000 |
No other historical records.
1, Pinewood Place, Bathgate EH47 7NX
| Today | See what it's worth now |
| 13 Feb 2026 | £300,000 |
| 19 Nov 2009 | £120,000 |
No other historical records.
16, Whitehill View, Blackburn EH47 7HR
| Today | See what it's worth now |
| 13 Feb 2026 | £105,000 |
No other historical records.
21, Beechwood Road, Bathgate EH47 7NF
| Today | See what it's worth now |
| 6 Feb 2026 | £125,000 |
| 3 Jul 2003 | £37,250 |
No other historical records.
217, Riddochhill Road, Bathgate EH47 7HG
| Today | See what it's worth now |
| 5 Feb 2026 | £200,000 |
| 29 Sep 2017 | £95,000 |
25, Rattray Gardens, Bathgate EH47 7QP
| Today | See what it's worth now |
| 4 Feb 2026 | £365,000 |
| 29 Sep 2014 | £235,000 |
No other historical records.
37a, Ash Grove, Bathgate EH47 7QJ
| Today | See what it's worth now |
| 2 Feb 2026 | £130,000 |
| 9 Jun 2008 | £105,000 |
1, Turf Place, Blackburn EH47 7JF
| Today | See what it's worth now |
| 23 Jan 2026 | £247,500 |
No other historical records.
21, Farrier Court, Blackburn EH47 7QN

| Today | See what it's worth now |
| 21 Jan 2026 | £147,500 |
No other historical records.
26, Whitehill Road, Bathgate EH47 7HQ
| Today | See what it's worth now |
| 20 Jan 2026 | £82,500 |
| 28 Jun 2004 | £58,000 |
No other historical records.
6, Mondelle, Mill Road, Blackburn EH47 7JZ
| Today | See what it's worth now |
| 14 Jan 2026 | £163,000 |
No other historical records.
5, Murrayfield Terrace, Bathgate EH47 7DE
| Today | See what it's worth now |
| 7 Jan 2026 | £135,000 |
| 20 Apr 2017 | £85,000 |

Source Acknowledgement: © Crown copyright. Scottish house price data is publicly available information produced by the Registers of Scotland. Material has been reproduced with the permission of the Keeper of the Registers of Scotland and contains data compiled by Registers of Scotland. For further information, please contact data@ros.gov.uk. Please note the dates shown here relate to the property's registered date not sold date.This material was last updated on 10 July 2026. It covers the period from 8 December 1987 to 30 April 2026 and contains property transactions which have been registered during that period.
Disclaimer: Rightmove.co.uk provides this Registers of Scotland data "as is". The burden for fitness of the data relies completely with the user and is provided for informational purposes only. No warranty, express or implied, is given relating to the accuracy of content of the Registers of Scotland data and Rightmove plc does not accept any liability for error or omission. If you have found an error with the data or need further information please contact data@ros.gov.uk
Permitted Use: The Registers of Scotland allows the reproduction of the data which it provides to Rightmove.co.uk free of charge in any format or medium only for research, private study or for internal circulation within an organisation. This is subject to it being reproduced accurately and not used in a misleading context. The material must be acknowledged as Crown Copyright. You are not allowed to use this information for commercial purposes, nor must you copy, distribute, sell or publish the data in any way. For any other use of this material, please apply to the Registers of Scotland for a licence. You can do this online at www.ros.gov.uk, by email at data@ros.gov.uk or by writing to Business Development, Registers of Scotland, Meadowbank House, 153 London Road, Edinburgh EH8 7AU.
Rightmove takes no liability for your use of, or reliance on, Rightmove's Instant Valuation due to the limitations of our tracking tool listed here. Use of this tool is taken entirely at your own risk. All rights reserved.