
House Prices in Blackcastle
House prices in Blackcastle have an overall average of £319,816 over the last year.
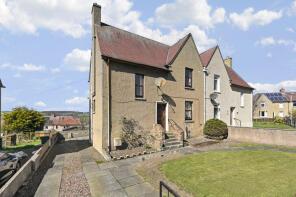
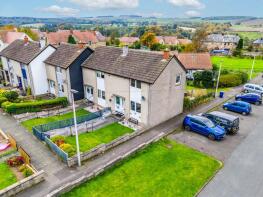
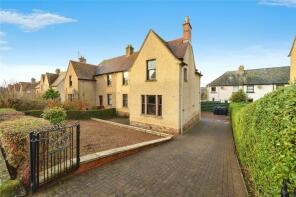
The majority of properties sold in Blackcastle during the last year were detached properties, selling for an average price of £487,125. Terraced properties sold for an average of £260,250, with flats fetching £167,500.
Overall, the historical sold prices in Blackcastle over the last year were 7% up on the previous year and 10% down on the 2021 peak of £354,088.
Properties Sold
Ford Mill Cottage, Ford, Pathhead EH37 5RE
| Today | See what it's worth now |
| 30 Apr 2026 | £312,000 |
| 18 Dec 2025 | £312,000 |
No other historical records.
176, Main Street, Pathhead EH37 5SG
| Today | See what it's worth now |
| 13 Apr 2026 | £156,500 |
| 12 Mar 2018 | £121,000 |
13, Fala Hall Road, Fala, Pathhead EH37 5SY
| Today | See what it's worth now |
| 18 Mar 2026 | £445,000 |
| 3 Jun 2019 | £375,050 |
95, Main Street, Pathhead EH37 5PT
| Today | See what it's worth now |
| 17 Feb 2026 | £260,000 |
No other historical records.
15, Dreepy Burn Drive, Pathhead EH37 5AB
| Today | See what it's worth now |
| 4 Feb 2026 | £385,000 |
| 30 Jan 2026 | £337,000 |
Edgehead Farmhouse, Edgehead Road, Edgehead, Pathhead EH37 5RL
| Today | See what it's worth now |
| 27 Jan 2026 | £320,000 |
| 19 Mar 2021 | £240,405 |
No other historical records.
185, Main Street, Pathhead EH37 5SQ
| Today | See what it's worth now |
| 20 Jan 2026 | £428,500 |
| 10 Nov 2006 | £355,000 |
No other historical records.
Calidris, Dalkeith EH37 5TX
| Today | See what it's worth now |
| 22 Dec 2025 | £695,000 |
| 1 Aug 2002 | £300,000 |
No other historical records.
178, Main Street, Pathhead EH37 5SG
| Today | See what it's worth now |
| 15 Dec 2025 | £268,000 |
No other historical records.
125, Main Street, Pathhead EH37 5PT
| Today | See what it's worth now |
| 8 Dec 2025 | £290,000 |
No other historical records.
156, Main Street, Pathhead EH37 5SG

| Today | See what it's worth now |
| 21 Nov 2025 | £170,000 |
No other historical records.
11, Crichton Village, Crichton, Pathhead EH37 5UZ
| Today | See what it's worth now |
| 20 Nov 2025 | £311,000 |
No other historical records.
9, Fala Dam, Pathhead EH37 5SU

| Today | See what it's worth now |
| 30 Oct 2025 | £300,000 |
No other historical records.
Loanhead Farm, Salter's Road, Pathhead EH37 5UR
| Today | See what it's worth now |
| 3 Oct 2025 | £325,217 |
No other historical records.
48, Main Street, Pathhead EH37 5QB
| Today | See what it's worth now |
| 16 Sep 2025 | £255,000 |
No other historical records.
4, Crichton Avenue, Pathhead EH37 5QG
| Today | See what it's worth now |
| 31 Jul 2025 | £125,500 |
| 8 Mar 2012 | £75,000 |
No other historical records.
2, Hill Road, Pathhead EH37 5RD
| Today | See what it's worth now |
| 10 Jul 2025 | £231,640 |
No other historical records.
3, Crichton Avenue, Pathhead EH37 5QG
| Today | See what it's worth now |
| 2 Jul 2025 | £120,000 |
No other historical records.
205, Main Street, Pathhead EH37 5SQ
| Today | See what it's worth now |
| 1 Jul 2025 | £380,000 |
| 8 Oct 2020 | £325,000 |
20, Main Street, Pathhead EH37 5QB
| Today | See what it's worth now |
| 26 Jun 2025 | £195,365 |
| 30 Sep 2016 | £153,756 |
No other historical records.
6, Crichton Terrace, Pathhead EH37 5QZ
| Today | See what it's worth now |
| 25 Jun 2025 | £175,000 |
No other historical records.
5, Dreepy Burn Drive, Pathhead EH37 5AB
| Today | See what it's worth now |
| 18 Jun 2025 | £350,000 |
No other historical records.
Grey Barn, Salter's Road, Pathhead EH37 5UP

| Today | See what it's worth now |
| 5 May 2025 | £41,000 |
No other historical records.
Source Acknowledgement: © Crown copyright. Scottish house price data is publicly available information produced by the Registers of Scotland. Material has been reproduced with the permission of the Keeper of the Registers of Scotland and contains data compiled by Registers of Scotland. For further information, please contact data@ros.gov.uk. Please note the dates shown here relate to the property's registered date not sold date.This material was last updated on 10 July 2026. It covers the period from 8 December 1987 to 30 April 2026 and contains property transactions which have been registered during that period.
Disclaimer: Rightmove.co.uk provides this Registers of Scotland data "as is". The burden for fitness of the data relies completely with the user and is provided for informational purposes only. No warranty, express or implied, is given relating to the accuracy of content of the Registers of Scotland data and Rightmove plc does not accept any liability for error or omission. If you have found an error with the data or need further information please contact data@ros.gov.uk
Permitted Use: The Registers of Scotland allows the reproduction of the data which it provides to Rightmove.co.uk free of charge in any format or medium only for research, private study or for internal circulation within an organisation. This is subject to it being reproduced accurately and not used in a misleading context. The material must be acknowledged as Crown Copyright. You are not allowed to use this information for commercial purposes, nor must you copy, distribute, sell or publish the data in any way. For any other use of this material, please apply to the Registers of Scotland for a licence. You can do this online at www.ros.gov.uk, by email at data@ros.gov.uk or by writing to Business Development, Registers of Scotland, Meadowbank House, 153 London Road, Edinburgh EH8 7AU.
Rightmove takes no liability for your use of, or reliance on, Rightmove's Instant Valuation due to the limitations of our tracking tool listed here. Use of this tool is taken entirely at your own risk. All rights reserved.