
House Prices in Blaengwawr
House prices in Blaengwawr have an overall average of £167,089 over the last year.
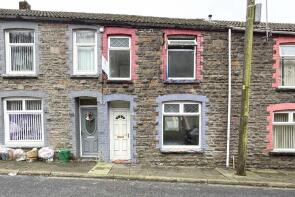
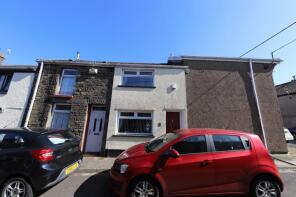
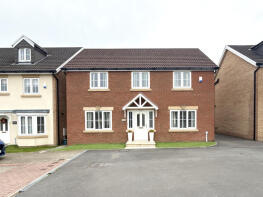
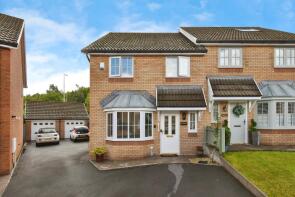
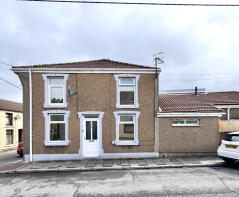
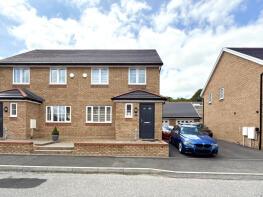
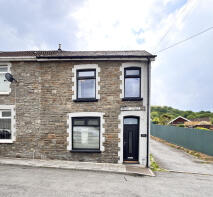
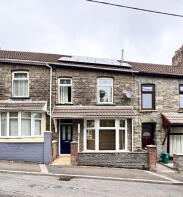
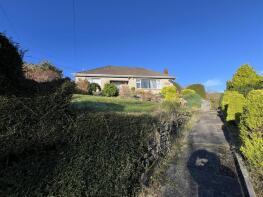
The majority of properties sold in Blaengwawr during the last year were terraced properties, selling for an average price of £121,842. Semi-detached properties sold for an average of £214,500, with detached properties fetching £339,444.
Overall, the historical sold prices in Blaengwawr over the last year were similar to the previous year and 11% up on the 2022 peak of £149,954.
Properties Sold
40, Brynhyfryd, Cwmaman, Aberdare CF44 6LG
| Today | See what it's worth now |
| 20 Mar 2026 | £95,000 |
| 9 Jan 2008 | £45,000 |
6, Kiln Street, Aberaman, Aberdare CF44 6YW
| Today | See what it's worth now |
| 9 Mar 2026 | £110,500 |
| 11 Feb 2022 | £103,500 |
40, Parc Aberaman, Aberaman, Aberdare CF44 6EY
| Today | See what it's worth now |
| 27 Feb 2026 | £335,000 |
| 3 Nov 2023 | £325,000 |
Gwenlais, Parc Aberaman, Aberaman, Aberdare CF44 6EY
| Today | See what it's worth now |
| 27 Feb 2026 | £240,000 |
No other historical records.
62d, Brook Street, Aberaman, Aberdare CF44 6YE
| Today | See what it's worth now |
| 23 Feb 2026 | £128,000 |
No other historical records.
Brookdale, Llanwonno Road, Cwmaman, Aberdare CF44 6PG
| Today | See what it's worth now |
| 13 Feb 2026 | £275,000 |
No other historical records.
15, Gladstone Street, Aberaman, Aberdare CF44 6SB
| Today | See what it's worth now |
| 13 Feb 2026 | £155,000 |
| 24 Nov 2021 | £137,000 |
27, Graig Avenue, Abercwmboi, Aberdare CF44 6AF
| Today | See what it's worth now |
| 4 Feb 2026 | £116,000 |
| 11 Jan 2008 | £74,950 |
2, Lord Street, Aberaman, Aberdare CF44 6UH
| Today | See what it's worth now |
| 30 Jan 2026 | £135,995 |
| 1 Nov 2018 | £93,500 |
26, Cynon Street, Aberaman, Aberdare CF44 6SG
| Today | See what it's worth now |
| 23 Jan 2026 | £118,000 |
No other historical records.
1, Burns Street, Cwmaman, Aberdare CF44 6HH
| Today | See what it's worth now |
| 23 Jan 2026 | £129,950 |
| 2 Jun 2008 | £90,000 |
36, Brook Street, Aberaman, Aberdare CF44 6YE

| Today | See what it's worth now |
| 16 Jan 2026 | £141,500 |
| 3 Nov 2017 | £87,500 |
64, Cardiff Road, Aberaman, Aberdare CF44 6HJ

| Today | See what it's worth now |
| 9 Jan 2026 | £255,000 |
| 19 Nov 2021 | £97,500 |
50, Dan-y-rhiw, Cwmaman, Aberdare CF44 6HU
| Today | See what it's worth now |
| 19 Dec 2025 | £100,000 |
| 9 Dec 2022 | £93,500 |
63, Jenkin Street, Abercwmboi, Aberdare CF44 6BB
| Today | See what it's worth now |
| 16 Dec 2025 | £135,000 |
No other historical records.
3, Brook Street, Aberaman, Aberdare CF44 6YN
| Today | See what it's worth now |
| 15 Dec 2025 | £122,286 |
| 9 Feb 2024 | £97,000 |
No other historical records.
37, Parc Aberaman, Aberaman, Aberdare CF44 6EY
| Today | See what it's worth now |
| 8 Dec 2025 | £215,000 |
| 12 Sep 2014 | £124,950 |
No other historical records.
1, Sunnybank Street, Aberaman, Aberdare CF44 6RJ
| Today | See what it's worth now |
| 3 Dec 2025 | £105,000 |
| 30 Jun 2000 | £5,000 |
No other historical records.
2, Alexandra Terrace, Cwmaman, Aberdare CF44 6NP
| Today | See what it's worth now |
| 25 Nov 2025 | £97,000 |
| 7 Apr 1998 | £23,500 |
No other historical records.
24, Rhodfa Cae Uchel, Aberaman, Aberdare CF44 6TL
| Today | See what it's worth now |
| 21 Nov 2025 | £240,000 |
| 6 Apr 2023 | £210,000 |
No other historical records.
15, Sunnybank Street, Aberaman, Aberdare CF44 6RJ
| Today | See what it's worth now |
| 7 Nov 2025 | £139,995 |
| 8 Dec 2023 | £133,000 |
23, Spencer Street, Cwmaman, Aberdare CF44 6HN
| Today | See what it's worth now |
| 31 Oct 2025 | £97,000 |
| 5 Dec 1997 | £29,450 |
No other historical records.
101, Brook Street, Aberaman, Aberdare CF44 6YD
| Today | See what it's worth now |
| 24 Oct 2025 | £175,000 |
| 7 Aug 2017 | £64,950 |
No other historical records.
20, Clarence Street, Aberaman, Aberdare CF44 6SD
| Today | See what it's worth now |
| 22 Oct 2025 | £125,000 |
| 27 Apr 1999 | £16,500 |
No other historical records.
Valberg, Fforchneol Row, Godreaman, Aberdare CF44 6HD
| Today | See what it's worth now |
| 21 Oct 2025 | £200,000 |
No other historical records.
Source Acknowledgement: © Crown copyright. England and Wales house price data is publicly available information produced by the HM Land Registry.This material was last updated on 15 May 2026. It covers the period from 1 January 1995 to 31 March 2026 and contains property transactions which have been registered during that period. Contains HM Land Registry data © Crown copyright and database right 2026. This data is licensed under the Open Government Licence v3.0.
Disclaimer: Rightmove.co.uk provides this HM Land Registry data "as is". The burden for fitness of the data relies completely with the user and is provided for informational purposes only. No warranty, express or implied, is given relating to the accuracy of content of the HM Land Registry data and Rightmove does not accept any liability for error or omission. If you have found an error with the data or need further information please contact HM Land Registry.
Permitted Use: Viewers of this Information are granted permission to access this Crown copyright material and to download it onto electronic, magnetic, optical or similar storage media provided that such activities are for private research, study or in-house use only. Any other use of the material requires the formal written permission of Land Registry which can be requested from us, and is subject to an additional licence and associated charge.
Map data ©OpenStreetMap contributors.
Rightmove takes no liability for your use of, or reliance on, Rightmove's Instant Valuation due to the limitations of our tracking tool listed here. Use of this tool is taken entirely at your own risk. All rights reserved.