
House Prices in Blaengwrach
House prices in Blaengwrach have an overall average of £176,076 over the last year.
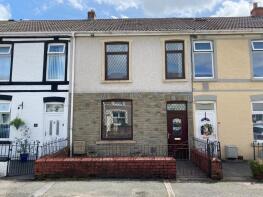
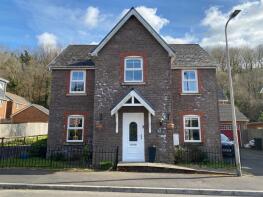
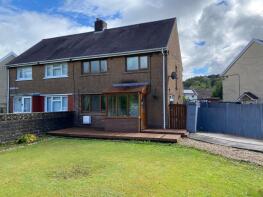
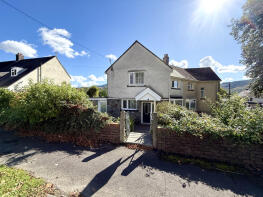
The majority of properties sold in Blaengwrach during the last year were semi-detached properties, selling for an average price of £166,662. Terraced properties sold for an average of £126,583, with detached properties fetching £279,889.
Overall, the historical sold prices in Blaengwrach over the last year were 1% down on the previous year and 7% up on the 2022 peak of £163,808.
Properties Sold
7, Heol Y Felin, Neath SA11 5TB
| Today | See what it's worth now |
| 2 Apr 2026 | £185,555 |
| 12 Apr 2013 | £65,000 |
No other historical records.
28, Cefn Gelli, Cwmgwrach SA11 5PE
| Today | See what it's worth now |
| 13 Mar 2026 | £125,000 |
No other historical records.
3, Heol Y Glyn, Neath SA11 5BB

| Today | See what it's worth now |
| 13 Mar 2026 | £172,000 |
| 4 Feb 2022 | £121,000 |
5, Bethania Street, Neath SA11 5DE
| Today | See what it's worth now |
| 27 Feb 2026 | £87,000 |
| 29 Jul 2019 | £76,000 |
No other historical records.
5, Maes Y Ceffyl, Neath SA11 5PJ
| Today | See what it's worth now |
| 25 Feb 2026 | £210,000 |
| 22 Feb 2013 | £130,000 |
No other historical records.
3, Church Crescent, Neath SA11 5SL
| Today | See what it's worth now |
| 23 Feb 2026 | £145,000 |
| 18 Sep 1997 | £22,500 |
No other historical records.
18, Edward Street, Glynneath SA11 5DL
| Today | See what it's worth now |
| 13 Feb 2026 | £145,000 |
No other historical records.
43, Ynys Y Nos, Pontwalby, Neath SA11 5LS
| Today | See what it's worth now |
| 9 Feb 2026 | £275,000 |
| 20 Dec 2021 | £260,000 |
29, Godfrey Avenue, Neath SA11 5HF
| Today | See what it's worth now |
| 16 Jan 2026 | £200,000 |
| 30 Apr 2021 | £140,000 |
7, Chain Road, Neath SA11 5HW
| Today | See what it's worth now |
| 16 Jan 2026 | £170,000 |
| 28 Jun 2019 | £128,500 |
42, Min Y Coed, Neath SA11 5RT
| Today | See what it's worth now |
| 13 Jan 2026 | £187,500 |
| 8 Aug 2022 | £172,500 |
25, Edward Street, Neath SA11 5DL

| Today | See what it's worth now |
| 17 Dec 2025 | £240,000 |
| 31 Oct 2022 | £122,500 |
No other historical records.
4, Ashmere Drive, Pont Nedd Fechan, Neath SA11 5NX
| Today | See what it's worth now |
| 17 Dec 2025 | £385,000 |
| 7 Aug 2020 | £350,000 |
No other historical records.
16, Heol Wenallt, Cwmgwrach SA11 5PT
| Today | See what it's worth now |
| 12 Dec 2025 | £87,000 |
No other historical records.
27, Merthyr Road, Pontwalby, Neath SA11 5LR

| Today | See what it's worth now |
| 11 Dec 2025 | £120,000 |
| 28 Oct 2016 | £105,000 |
13, Edward Street, Neath SA11 5DL
| Today | See what it's worth now |
| 9 Dec 2025 | £140,000 |
| 22 Mar 2018 | £70,000 |
22, Min Y Coed, Neath SA11 5RT
| Today | See what it's worth now |
| 5 Dec 2025 | £180,000 |
| 20 Nov 2007 | £115,000 |
No other historical records.
7, Llewellyn Street, Neath SA11 5AE
| Today | See what it's worth now |
| 28 Nov 2025 | £179,000 |
| 17 Nov 2000 | £34,400 |
No other historical records.
61, Morfa Glas, Glynneath SA11 5RW
| Today | See what it's worth now |
| 21 Nov 2025 | £135,000 |
No other historical records.
81, High Street, Neath SA11 5AL
| Today | See what it's worth now |
| 21 Nov 2025 | £170,000 |
| 13 Aug 1999 | £44,750 |
No other historical records.
2, Ynyslas Crescent, Glynneath SA11 5LB
| Today | See what it's worth now |
| 21 Nov 2025 | £135,000 |
No other historical records.
7, Ger Y Nant, Neath SA11 5RN
| Today | See what it's worth now |
| 14 Nov 2025 | £155,000 |
| 21 Jan 2022 | £129,995 |
No other historical records.
85, Morfa Glas, Glynneath SA11 5RW

| Today | See what it's worth now |
| 7 Nov 2025 | £146,000 |
No other historical records.
Source Acknowledgement: © Crown copyright. England and Wales house price data is publicly available information produced by the HM Land Registry.This material was last updated on 9 July 2026. It covers the period from 1 January 1995 to 30 April 2026 and contains property transactions which have been registered during that period. Contains HM Land Registry data © Crown copyright and database right 2026. This data is licensed under the Open Government Licence v3.0.
Disclaimer: Rightmove.co.uk provides this HM Land Registry data "as is". The burden for fitness of the data relies completely with the user and is provided for informational purposes only. No warranty, express or implied, is given relating to the accuracy of content of the HM Land Registry data and Rightmove does not accept any liability for error or omission. If you have found an error with the data or need further information please contact HM Land Registry.
Permitted Use: Viewers of this Information are granted permission to access this Crown copyright material and to download it onto electronic, magnetic, optical or similar storage media provided that such activities are for private research, study or in-house use only. Any other use of the material requires the formal written permission of Land Registry which can be requested from us, and is subject to an additional licence and associated charge.
Rightmove takes no liability for your use of, or reliance on, Rightmove's Instant Valuation due to the limitations of our tracking tool listed here. Use of this tool is taken entirely at your own risk. All rights reserved.