
House Prices in Blenkinsopp
House prices in Blenkinsopp have an overall average of £216,167 over the last year.
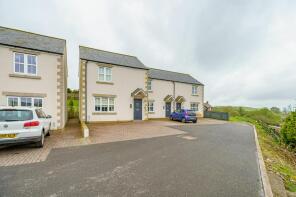
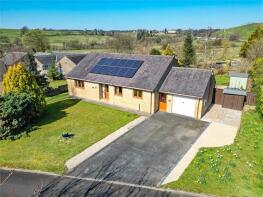
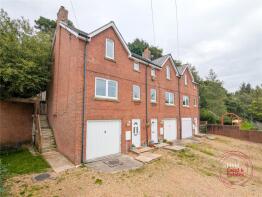
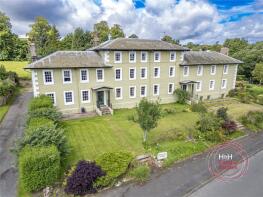
The majority of properties sold in Blenkinsopp during the last year were detached properties, selling for an average price of £335,000. Terraced properties sold for an average of £151,375, with semi-detached properties fetching £142,333.
Overall, the historical sold prices in Blenkinsopp over the last year were 8% down on the previous year and 1% down on the 2007 peak of £218,414.
Properties Sold
11, The Forge, Brampton CA8 7TF
| Today | See what it's worth now |
| 15 Apr 2026 | £165,000 |
| 23 Oct 2019 | £115,000 |
No other historical records.
16, Irthing Park, Gilsland CA8 7DL
| Today | See what it's worth now |
| 31 Mar 2026 | £330,000 |
No other historical records.
West Cottage Bank Top, U7084 Old Greenhead Bank, Greenhead CA8 7HA

| Today | See what it's worth now |
| 18 Feb 2026 | £167,000 |
No other historical records.
1, Carlton Trice, Brampton CA8 7BU
| Today | See what it's worth now |
| 19 Dec 2025 | £168,000 |
| 19 Jul 2019 | £118,000 |
No other historical records.
The Chapel, U7002 Eals Village Junction To Whitwham, Brampton CA8 7PG
| Today | See what it's worth now |
| 12 Dec 2025 | £280,000 |
| 6 Jan 2023 | £310,000 |
7, Orchard House, Gilsland CA8 7AJ
| Today | See what it's worth now |
| 19 Nov 2025 | £110,000 |
| 10 Jul 2023 | £98,000 |
Runnerfoot Cottage, C300 Gilsland To Gap Shield, Brampton CA8 7DR
| Today | See what it's worth now |
| 14 Nov 2025 | £130,000 |
| 21 May 2020 | £73,500 |
No other historical records.
Onnum, U7028 Lawn Top Junction To Runner Foot, Brampton CA8 7EH
| Today | See what it's worth now |
| 31 Oct 2025 | £90,000 |
| 24 Aug 2006 | £120,000 |
No other historical records.
10, High Castle Terrace, Greenhead CA8 7HU
| Today | See what it's worth now |
| 24 Oct 2025 | £127,500 |
No other historical records.
20, Pennine Road, Brampton CA8 7LB
| Today | See what it's worth now |
| 16 Oct 2025 | £130,000 |
| 14 Oct 1998 | £26,500 |
No other historical records.
Stoneybeck, Longbyre, Brampton CA8 7HN

| Today | See what it's worth now |
| 4 Sep 2025 | £425,000 |
| 30 Sep 2016 | £248,000 |
No other historical records.
4, Hadrians Crescent, Brampton CA8 7BP
| Today | See what it's worth now |
| 1 Sep 2025 | £290,000 |
| 20 Jul 2012 | £133,000 |
No other historical records.
6, High Castle Terrace, Brampton CA8 7HU

| Today | See what it's worth now |
| 29 Aug 2025 | £145,000 |
| 9 Mar 2021 | £100,000 |
Greenriggs, Lambley CA8 7LN
| Today | See what it's worth now |
| 15 Aug 2025 | £410,000 |
No other historical records.
Crantock, C300 Gilsland To Gap Shield, Brampton CA8 7DX
| Today | See what it's worth now |
| 28 Jul 2025 | £275,000 |
| 22 Jan 1999 | £35,000 |
No other historical records.
Roman Wall Villa, Road Leading From Gilsland To Denton Main Farm Road End, Brampton CA8 7AA
| Today | See what it's worth now |
| 19 Jun 2025 | £270,000 |
| 22 Aug 2014 | £200,000 |
1, Springhead Cottages, U7076 Slaggyford Main Road To Greenhead Road, Brampton CA8 7NH
| Today | See what it's worth now |
| 6 Jun 2025 | £140,000 |
| 22 May 2015 | £128,000 |
Wayside, Bankfoot, Greenhead CA8 7JQ
| Today | See what it's worth now |
| 3 Jun 2025 | £120,000 |
No other historical records.
Pathways, B6318 Gilsland Main Road, Brampton CA8 7DR
| Today | See what it's worth now |
| 16 May 2025 | £90,000 |
| 17 Feb 2014 | £78,000 |
Low Darkdale, Darkdale Walk, Brampton CA8 7NW
| Today | See what it's worth now |
| 7 May 2025 | £532,000 |
| 12 Sep 2018 | £335,000 |
No other historical records.
Braeside, U7006 Lambley Main Road Through Village, Brampton CA8 7LQ
| Today | See what it's worth now |
| 10 Apr 2025 | £287,000 |
| 6 Nov 2007 | £165,000 |
Thornley Cottage, U7006 Lambley Main Road Through Village, Brampton CA8 7LQ

| Today | See what it's worth now |
| 10 Apr 2025 | £382,500 |
| 1 Mar 2021 | £320,000 |
Dovecott Barn, A689 Slaggyford Main Road Through Village, Slaggyford CA8 7NH
| Today | See what it's worth now |
| 25 Mar 2025 | £195,000 |
No other historical records.
Source Acknowledgement: © Crown copyright. England and Wales house price data is publicly available information produced by the HM Land Registry.This material was last updated on 9 July 2026. It covers the period from 1 January 1995 to 30 April 2026 and contains property transactions which have been registered during that period. Contains HM Land Registry data © Crown copyright and database right 2026. This data is licensed under the Open Government Licence v3.0.
Disclaimer: Rightmove.co.uk provides this HM Land Registry data "as is". The burden for fitness of the data relies completely with the user and is provided for informational purposes only. No warranty, express or implied, is given relating to the accuracy of content of the HM Land Registry data and Rightmove does not accept any liability for error or omission. If you have found an error with the data or need further information please contact HM Land Registry.
Permitted Use: Viewers of this Information are granted permission to access this Crown copyright material and to download it onto electronic, magnetic, optical or similar storage media provided that such activities are for private research, study or in-house use only. Any other use of the material requires the formal written permission of Land Registry which can be requested from us, and is subject to an additional licence and associated charge.
Rightmove takes no liability for your use of, or reliance on, Rightmove's Instant Valuation due to the limitations of our tracking tool listed here. Use of this tool is taken entirely at your own risk. All rights reserved.