
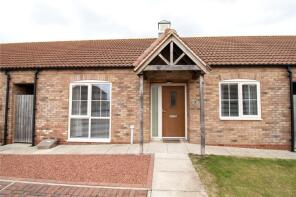
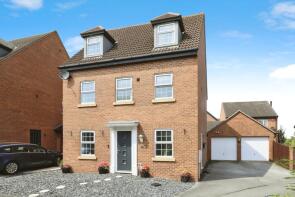
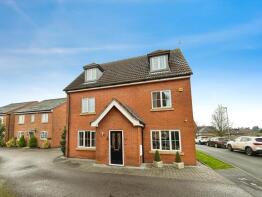
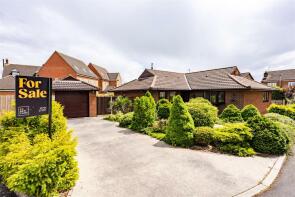
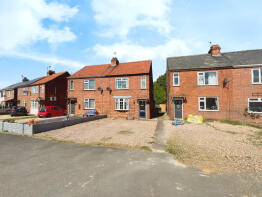
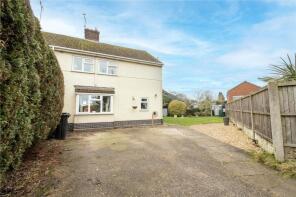
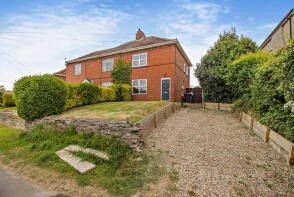
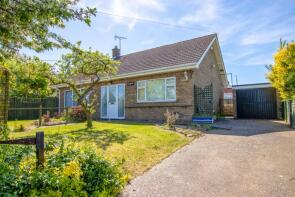
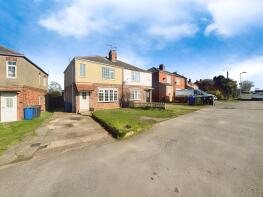
House Prices in Blyton
House prices in Blyton have an overall average of £222,147 over the last year.
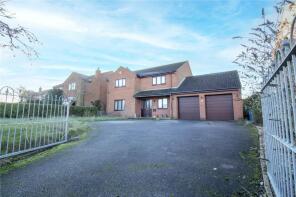
The majority of properties sold in Blyton during the last year were detached properties, selling for an average price of £265,650. Semi-detached properties sold for an average of £172,833, with flats fetching £83,000.
Overall, the historical sold prices in Blyton over the last year were 8% down on the previous year and 16% down on the 2023 peak of £265,111.
Properties Sold
8, Fieldside, Blyton, Gainsborough DN21 3NZ
| Today | See what it's worth now |
| 23 Mar 2026 | £155,000 |
| 19 Aug 2022 | £125,000 |
No other historical records.
38, Irwin Road, Blyton, Gainsborough DN21 3LS
| Today | See what it's worth now |
| 16 Jan 2026 | £305,000 |
| 21 Jun 2024 | £290,000 |
19, Irwin Road, Blyton, Gainsborough DN21 3LS
| Today | See what it's worth now |
| 15 Jan 2026 | £83,000 |
| 26 Jul 2018 | £72,000 |
63b, High Street, Blyton, Gainsborough DN21 3JX
| Today | See what it's worth now |
| 9 Jan 2026 | £280,000 |
| 27 May 2021 | £237,500 |
7, Owens View, Blyton, Gainsborough DN21 3FA
| Today | See what it's worth now |
| 19 Dec 2025 | £155,000 |
| 4 Aug 2020 | £140,000 |
No other historical records.
7, Irwin Road, Blyton, Gainsborough DN21 3LS
| Today | See what it's worth now |
| 28 Nov 2025 | £308,500 |
| 6 Jun 2022 | £290,500 |
33, Irwin Road, Blyton, Gainsborough DN21 3LS
| Today | See what it's worth now |
| 20 Nov 2025 | £318,000 |
| 28 Aug 2017 | £206,000 |
16, Rustic Lane, Blyton, Gainsborough DN21 3LP
| Today | See what it's worth now |
| 20 Nov 2025 | £230,000 |
| 31 Jan 2002 | £81,950 |
No other historical records.
29, Kirton Road, Blyton, Gainsborough DN21 3LB
| Today | See what it's worth now |
| 24 Oct 2025 | £165,000 |
| 9 Jan 2009 | £90,000 |
4, Haven Close, Blyton, Gainsborough DN21 3PG
| Today | See what it's worth now |
| 25 Sep 2025 | £325,000 |
| 27 Mar 1995 | £101,500 |
No other historical records.
1, Kirton Road, Blyton, Gainsborough DN21 3LB
| Today | See what it's worth now |
| 15 Sep 2025 | £255,000 |
| 27 Sep 2017 | £215,000 |
28, Irwin Road, Blyton, Gainsborough DN21 3LS
| Today | See what it's worth now |
| 15 Sep 2025 | £370,000 |
| 16 Mar 2007 | £260,000 |
No other historical records.
88, High Street, Blyton, Gainsborough DN21 3LA

| Today | See what it's worth now |
| 29 Aug 2025 | £175,000 |
| 28 Feb 2022 | £185,000 |
No other historical records.
17, Hickman Grove, Blyton, Gainsborough DN21 3NN
| Today | See what it's worth now |
| 20 Aug 2025 | £175,000 |
| 15 Jun 2011 | £95,000 |
56, High Street, Blyton, Gainsborough DN21 3JY
| Today | See what it's worth now |
| 15 Aug 2025 | £142,000 |
| 28 Feb 2019 | £112,000 |
11, Paddock Lane, Blyton, Gainsborough DN21 3NF
| Today | See what it's worth now |
| 15 Aug 2025 | £190,000 |
| 11 Apr 2014 | £132,000 |
39, Kirton Road, Blyton, Gainsborough DN21 3LF
| Today | See what it's worth now |
| 11 Jul 2025 | £145,000 |
| 22 Nov 2006 | £109,950 |
12 Mill Farmhouse, Gainsborough Road, Blyton, Gainsborough DN21 3NJ
| Today | See what it's worth now |
| 11 Jun 2025 | £343,000 |
| 5 Aug 2005 | £195,000 |
No other historical records.
17, Kirton Road, Blyton, Gainsborough DN21 3LB
| Today | See what it's worth now |
| 22 May 2025 | £194,000 |
No other historical records.
4, Paddock Lane, Blyton, Gainsborough DN21 3NE
| Today | See what it's worth now |
| 21 Mar 2025 | £235,000 |
| 31 Oct 2008 | £125,000 |
4, Gainsborough Road, Blyton, Gainsborough DN21 3NB
| Today | See what it's worth now |
| 21 Mar 2025 | £319,500 |
| 6 Oct 2023 | £265,000 |
29, Irwin Road, Blyton, Gainsborough DN21 3LS
| Today | See what it's worth now |
| 20 Mar 2025 | £310,000 |
| 22 Mar 2019 | £245,000 |
57, High Street, Blyton, Gainsborough DN21 3JX

| Today | See what it's worth now |
| 14 Mar 2025 | £80,000 |
No other historical records.
Source Acknowledgement: © Crown copyright. England and Wales house price data is publicly available information produced by the HM Land Registry.This material was last updated on 9 July 2026. It covers the period from 1 January 1995 to 30 April 2026 and contains property transactions which have been registered during that period. Contains HM Land Registry data © Crown copyright and database right 2026. This data is licensed under the Open Government Licence v3.0.
Disclaimer: Rightmove.co.uk provides this HM Land Registry data "as is". The burden for fitness of the data relies completely with the user and is provided for informational purposes only. No warranty, express or implied, is given relating to the accuracy of content of the HM Land Registry data and Rightmove does not accept any liability for error or omission. If you have found an error with the data or need further information please contact HM Land Registry.
Permitted Use: Viewers of this Information are granted permission to access this Crown copyright material and to download it onto electronic, magnetic, optical or similar storage media provided that such activities are for private research, study or in-house use only. Any other use of the material requires the formal written permission of Land Registry which can be requested from us, and is subject to an additional licence and associated charge.
Rightmove takes no liability for your use of, or reliance on, Rightmove's Instant Valuation due to the limitations of our tracking tool listed here. Use of this tool is taken entirely at your own risk. All rights reserved.