
House Prices in Bottoms
House prices in Bottoms have an overall average of £387,409 over the last year.
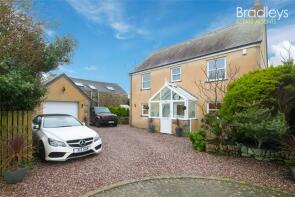
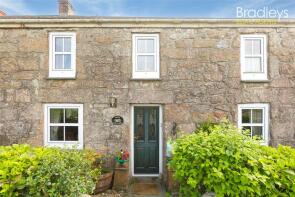
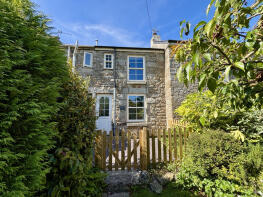
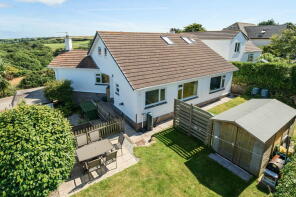
The majority of properties sold in Bottoms during the last year were detached properties, selling for an average price of £435,017. Terraced properties sold for an average of £340,000, with semi-detached properties fetching £396,667.
Overall, the historical sold prices in Bottoms over the last year were 20% down on the previous year and 22% down on the 2022 peak of £494,290.
Properties Sold
3 Cavendish House, Tower Meadows, Penzance TR19 6AJ
| Today | See what it's worth now |
| 27 Mar 2026 | £447,000 |
| 13 Feb 2004 | £200,000 |
Rose Cottage, A30 Between Bolankan And Trevorgans Cross, Crows-an-wra, Penzance TR19 6HU
| Today | See what it's worth now |
| 20 Mar 2026 | £345,000 |
| 24 Jul 1998 | £79,950 |
First Floor Apartment, The Hayloft, The Valley, St. Levan, Porthcurno TR19 6JY
| Today | See what it's worth now |
| 13 Mar 2026 | £220,000 |
| 2 Dec 2021 | £270,000 |
No other historical records.
2, Trungle Terrace, Penzance TR19 6UE
| Today | See what it's worth now |
| 11 Mar 2026 | £250,000 |
| 5 Jul 2019 | £150,000 |
No other historical records.
Ding Dong, Lowena Close, Penzance TR19 6BB
| Today | See what it's worth now |
| 24 Feb 2026 | £625,000 |
| 7 Oct 1998 | £155,000 |
No other historical records.
The Old Cattle Shed, Tresidder, St. Buryan, St Buryan TR19 6EZ
| Today | See what it's worth now |
| 20 Feb 2026 | £650,000 |
| 18 Jan 2021 | £665,000 |
No other historical records.
4, Avrack Close, Lower Drift, Penzance TR19 6AH
| Today | See what it's worth now |
| 27 Jan 2026 | £200,000 |
| 13 Feb 1998 | £74,500 |
No other historical records.
Birch Studio, Road From Junction South Of Lamorna Gate To Lamorna Quay, Penzance TR19 6XQ
| Today | See what it's worth now |
| 22 Jan 2026 | £405,000 |
| 19 Jul 2022 | £375,000 |
Rosteague, Access To Raginnis Farm, Raginnis, Penzance TR19 6NJ

| Today | See what it's worth now |
| 12 Jan 2026 | £760,000 |
| 4 Apr 2018 | £355,000 |
No other historical records.
The Bowjey, Lamorna TR19 6NY
| Today | See what it's worth now |
| 15 Dec 2025 | £300,000 |
No other historical records.
Tater Du, The Old Hotel, The Valley, Penzance TR19 6AX
| Today | See what it's worth now |
| 28 Nov 2025 | £145,000 |
| 23 Jun 2017 | £137,000 |
Horizon View, Parc An Peath, St. Buryan, St Buryan TR19 6EW
| Today | See what it's worth now |
| 17 Nov 2025 | £525,000 |
No other historical records.
Lamorna Cove Cafe, Lamorna TR19 6XQ
| Today | See what it's worth now |
| 22 Oct 2025 | £320,000 |
No other historical records.
5, Trunglemoor Cottages, Trungle, Paul TR19 6UF
| Today | See what it's worth now |
| 21 Oct 2025 | £230,000 |
No other historical records.
Ark Bungalow, Lamorna TR19 6XN
| Today | See what it's worth now |
| 26 Sep 2025 | £420,000 |
No other historical records.
Alma House, School Hill, Penzance TR19 6LP
| Today | See what it's worth now |
| 19 Sep 2025 | £400,000 |
| 10 Oct 2012 | £197,000 |
No other historical records.
4b, Cherry Garden Street, Penzance TR19 6RN
| Today | See what it's worth now |
| 19 Sep 2025 | £280,000 |
| 6 Nov 2000 | £91,000 |
No other historical records.
2, Trungle Parc, Penzance TR19 6XB
| Today | See what it's worth now |
| 1 Sep 2025 | £346,532 |
| 18 Nov 1996 | £82,000 |
No other historical records.
Harvon Lee, Road From St Pol De Leon View To Boslandew Hill, Trungle, Penzance TR19 6UG

| Today | See what it's worth now |
| 26 Aug 2025 | £380,000 |
| 14 Feb 2019 | £275,000 |
Little Paddock, Rectory Road, Penzance TR19 6BB
| Today | See what it's worth now |
| 6 Aug 2025 | £525,000 |
| 27 May 2022 | £436,000 |
Elstree Cottage, A30 Between Drift Crossroads And Penvale House, Lower Drift, Penzance TR19 6AA
| Today | See what it's worth now |
| 1 Aug 2025 | £345,000 |
| 7 Oct 2022 | £225,000 |
Tresidder, Access Track To Tresidder, Penzance TR19 6EZ
| Today | See what it's worth now |
| 11 Jul 2025 | £250,000 |
| 28 Jul 2016 | £790,000 |
High Stones, School Hill, Penzance TR19 6LJ
| Today | See what it's worth now |
| 10 Jul 2025 | £489,200 |
| 6 Nov 2017 | £371,500 |
Source Acknowledgement: © Crown copyright. England and Wales house price data is publicly available information produced by the HM Land Registry.This material was last updated on 9 July 2026. It covers the period from 1 January 1995 to 30 April 2026 and contains property transactions which have been registered during that period. Contains HM Land Registry data © Crown copyright and database right 2026. This data is licensed under the Open Government Licence v3.0.
Disclaimer: Rightmove.co.uk provides this HM Land Registry data "as is". The burden for fitness of the data relies completely with the user and is provided for informational purposes only. No warranty, express or implied, is given relating to the accuracy of content of the HM Land Registry data and Rightmove does not accept any liability for error or omission. If you have found an error with the data or need further information please contact HM Land Registry.
Permitted Use: Viewers of this Information are granted permission to access this Crown copyright material and to download it onto electronic, magnetic, optical or similar storage media provided that such activities are for private research, study or in-house use only. Any other use of the material requires the formal written permission of Land Registry which can be requested from us, and is subject to an additional licence and associated charge.
Rightmove takes no liability for your use of, or reliance on, Rightmove's Instant Valuation due to the limitations of our tracking tool listed here. Use of this tool is taken entirely at your own risk. All rights reserved.