
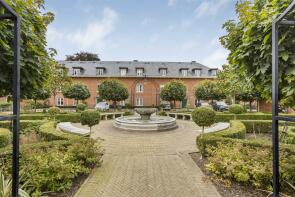
House Prices in Bourne Orchard
House prices in Bourne Orchard have an overall average of £645,240 over the last year.
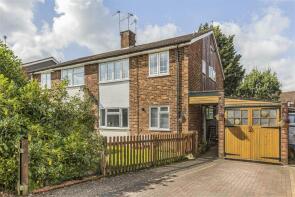
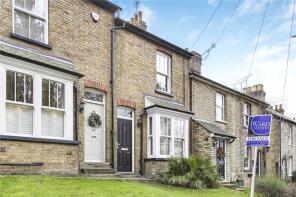
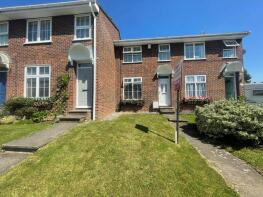
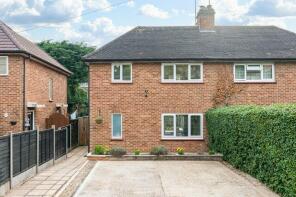
The majority of properties sold in Bourne Orchard during the last year were semi-detached properties, selling for an average price of £654,391. Terraced properties sold for an average of £533,179, with flats fetching £431,591.
Overall, the historical sold prices in Bourne Orchard over the last year were 8% down on the previous year and 4% down on the 2016 peak of £669,726.
Properties Sold
8, The Mansion, Road From Mangrove Road Through Balls Park To London Road, Balls Park, Hertford SG13 8FJ
| Today | See what it's worth now |
| 24 Jun 2025 | £650,000 |
| 3 May 2013 | £860,000 |
No other historical records.
2, Peacock Close, Hertford SG13 8FT
| Today | See what it's worth now |
| 16 May 2025 | £1,100,000 |
| 20 Dec 2022 | £1,059,950 |
No other historical records.
7, Springfield Lodge, Mangrove Road, Hertford SG13 8GL
| Today | See what it's worth now |
| 15 May 2025 | £500,000 |
| 10 Sep 2022 | £450,000 |
The Old Stables, Stockings Lane, Hertford SG13 8LW
| Today | See what it's worth now |
| 24 Apr 2025 | £925,000 |
| 26 Feb 2007 | £430,000 |
47, Henmarsh Court, Balls Park, Hertford SG13 8FB
| Today | See what it's worth now |
| 31 Mar 2025 | £320,000 |
| 26 Feb 2021 | £285,000 |
24, Wilton Crescent, Hertford SG13 8JW
| Today | See what it's worth now |
| 27 Mar 2025 | £320,000 |
| 24 Feb 2014 | £190,000 |
30, Bullocks Lane, Hertford SG13 8DB
| Today | See what it's worth now |
| 21 Mar 2025 | £465,000 |
| 7 Mar 2013 | £299,950 |
37, Tanners Crescent, Hertford SG13 8DS
| Today | See what it's worth now |
| 7 Mar 2025 | £450,000 |
| 28 May 2009 | £228,000 |
30, Liberty Close, Hertford SG13 8JY
| Today | See what it's worth now |
| 28 Feb 2025 | £437,500 |
| 25 Jan 1999 | £91,500 |
No other historical records.
8, Hagsdell Road, Hertford SG13 8AG
| Today | See what it's worth now |
| 26 Feb 2025 | £1,490,000 |
| 26 Jul 2019 | £735,000 |
No other historical records.
22, Church Road, Hertford SG13 8LY
| Today | See what it's worth now |
| 18 Feb 2025 | £870,000 |
| 7 Jul 2003 | £350,000 |
No other historical records.
18, Pimlico Court, Pegs Lane, Hertford SG13 8EB
| Today | See what it's worth now |
| 18 Feb 2025 | £280,000 |
| 11 Aug 2004 | £195,000 |
No other historical records.
4, Lancaster House, Hale Road, Hertford SG13 8FS


| Today | See what it's worth now |
| 14 Feb 2025 | £492,500 |
No other historical records.
7, Lancaster House, Hale Road, Hertford SG13 8FS
| Today | See what it's worth now |
| 14 Feb 2025 | £490,000 |
No other historical records.
7, The Chestnuts, Hertford SG13 8AQ
| Today | See what it's worth now |
| 13 Feb 2025 | £1,005,000 |
No other historical records.
44, Brickendon Lane, Hertford SG13 8HY
| Today | See what it's worth now |
| 7 Feb 2025 | £485,000 |
| 6 Apr 2018 | £356,000 |
No other historical records.
Flat 4, 33, Queens Road, Hertford SG13 8AZ

| Today | See what it's worth now |
| 31 Jan 2025 | £450,000 |
| 24 Sep 2021 | £395,000 |
4, Waterdale, Hertford SG13 8DU
| Today | See what it's worth now |
| 30 Jan 2025 | £535,000 |
| 5 Sep 2008 | £315,000 |
44, Bullocks Lane, Hertford SG13 8DB
| Today | See what it's worth now |
| 30 Jan 2025 | £440,000 |
| 30 Sep 2021 | £430,000 |
24, Brickendon Lane, Hertford SG13 8HY
| Today | See what it's worth now |
| 21 Jan 2025 | £425,000 |
| 5 Jan 2018 | £345,000 |
No other historical records.
84, Mandeville Road, Hertford SG13 8JJ
| Today | See what it's worth now |
| 7 Jan 2025 | £480,000 |
No other historical records.
58, Mandeville Road, Hertford SG13 8JQ
| Today | See what it's worth now |
| 13 Dec 2024 | £1,157,000 |
| 5 Nov 2015 | £788,874 |
15, Thompson Way, Hertford SG13 8FX
| Today | See what it's worth now |
| 13 Dec 2024 | £827,500 |
| 20 Oct 2023 | £819,950 |
No other historical records.
17, The Mansion, Road From Mangrove Road Through Balls Park To London Road, Balls Park, Hertford SG13 8FJ
| Today | See what it's worth now |
| 12 Dec 2024 | £420,000 |
| 25 Nov 2014 | £387,950 |
8, Henderson Place, Hertford SG13 8GA

| Today | See what it's worth now |
| 6 Dec 2024 | £1,395,000 |
| 16 Feb 2007 | £680,000 |
Get ready with a Mortgage in Principle
- Personalised result in just 20 minutes
- Find out how much you can borrow
- Get viewings faster with agents
- No impact on your credit score
What's your property worth?
Source Acknowledgement: © Crown copyright. England and Wales house price data is publicly available information produced by the HM Land Registry.This material was last updated on 6 August 2025. It covers the period from 1 January 1995 to 30 June 2025 and contains property transactions which have been registered during that period. Contains HM Land Registry data © Crown copyright and database right 2025. This data is licensed under the Open Government Licence v3.0.
Disclaimer: Rightmove.co.uk provides this HM Land Registry data "as is". The burden for fitness of the data relies completely with the user and is provided for informational purposes only. No warranty, express or implied, is given relating to the accuracy of content of the HM Land Registry data and Rightmove does not accept any liability for error or omission. If you have found an error with the data or need further information please contact HM Land Registry.
Permitted Use: Viewers of this Information are granted permission to access this Crown copyright material and to download it onto electronic, magnetic, optical or similar storage media provided that such activities are for private research, study or in-house use only. Any other use of the material requires the formal written permission of Land Registry which can be requested from us, and is subject to an additional licence and associated charge.
Map data ©OpenStreetMap contributors.
Rightmove takes no liability for your use of, or reliance on, Rightmove's Instant Valuation due to the limitations of our tracking tool listed here. Use of this tool is taken entirely at your own risk. All rights reserved.