
House Prices in Bowburn
House prices in Bowburn have an overall average of £159,934 over the last year.
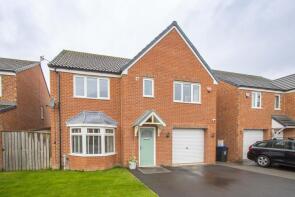
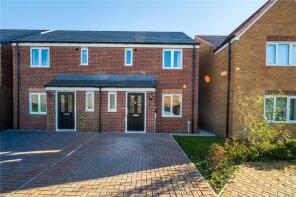
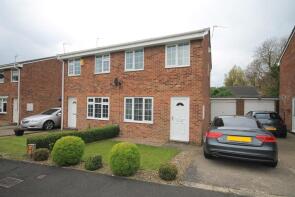
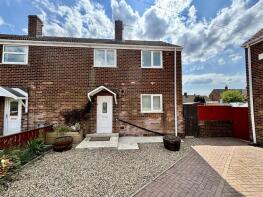
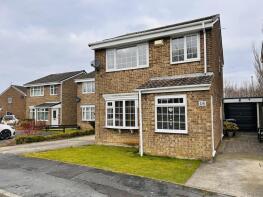
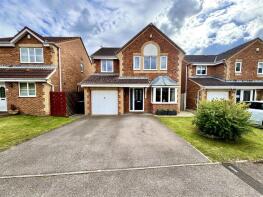
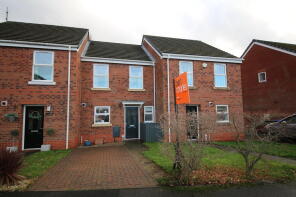
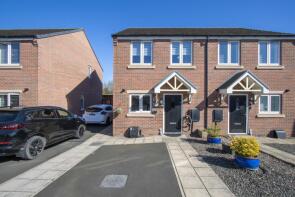
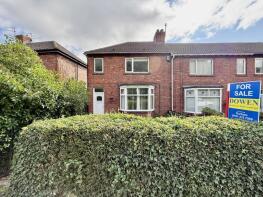
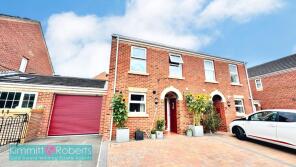
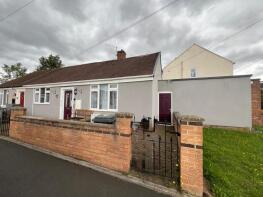
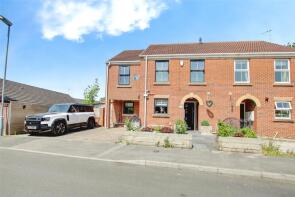
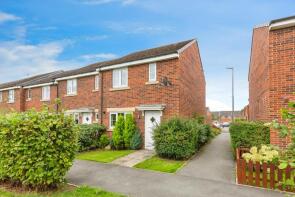
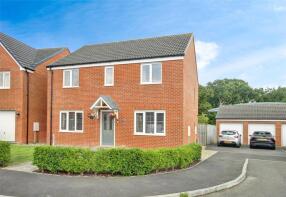
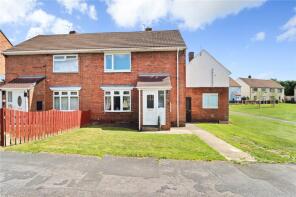
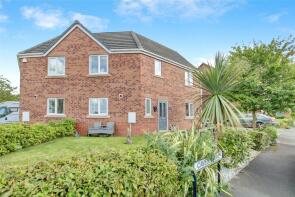
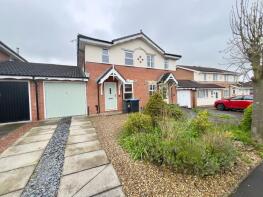
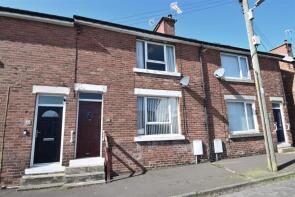
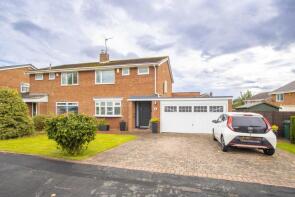
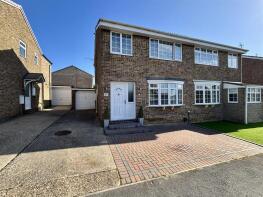
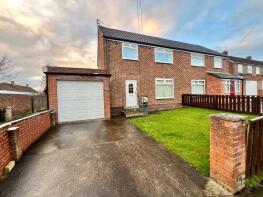
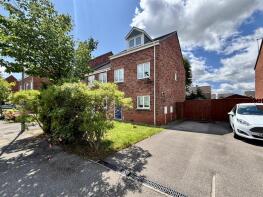
The majority of properties sold in Bowburn during the last year were semi-detached properties, selling for an average price of £147,216. Terraced properties sold for an average of £107,468, with detached properties fetching £254,531.
Overall, the historical sold prices in Bowburn over the last year were 12% down on the previous year and 7% down on the 2023 peak of £172,179.
Properties Sold
17, Cranson Close, Durham DH6 5AP
| Today | See what it's worth now |
| 1 Apr 2026 | £322,000 |
| 11 Dec 2017 | £214,950 |
No other historical records.
5, Forge Close, Durham DH6 5FL
| Today | See what it's worth now |
| 1 Apr 2026 | £182,500 |
| 28 Apr 2023 | £163,750 |
No other historical records.
31, Millford Way, Durham DH6 5DE
| Today | See what it's worth now |
| 27 Mar 2026 | £27,000 |
| 7 Jul 2017 | £100,000 |
49, Henry Avenue, Durham DH6 5EN
| Today | See what it's worth now |
| 27 Mar 2026 | £145,000 |
| 17 Feb 2023 | £103,500 |
No other historical records.
14, Leyland Close, Durham DH6 5DD
| Today | See what it's worth now |
| 18 Mar 2026 | £195,000 |
| 30 May 1997 | £54,950 |
No other historical records.
22, Beaumont Close, Durham DH6 5QA
| Today | See what it's worth now |
| 18 Mar 2026 | £299,950 |
| 25 Sep 1998 | £76,995 |
No other historical records.
18, Mccormick Close, Durham DH6 5BY
| Today | See what it's worth now |
| 13 Mar 2026 | £110,000 |
| 16 Mar 2018 | £77,500 |
9, Hill Top View, Bowburn DH6 5BU
| Today | See what it's worth now |
| 6 Mar 2026 | £135,000 |
No other historical records.
6, Tweddle Terrace, Durham DH6 5AF
| Today | See what it's worth now |
| 6 Mar 2026 | £85,000 |
| 3 Aug 2007 | £77,000 |
No other historical records.
25, Charlton Court, Durham DH6 5FB
| Today | See what it's worth now |
| 5 Mar 2026 | £150,000 |
| 24 Feb 2006 | £134,995 |
No other historical records.
31, Margaret Court, Bowburn DH6 5DX
| Today | See what it's worth now |
| 27 Feb 2026 | £80,000 |
No other historical records.
45, Surtees Avenue, Bowburn DH6 5DZ

| Today | See what it's worth now |
| 6 Feb 2026 | £106,000 |
No other historical records.
63, Lawson Road, Durham DH6 5ED
| Today | See what it's worth now |
| 6 Feb 2026 | £205,000 |
| 21 Jul 2006 | £132,995 |
No other historical records.
17, Steavenson Street, Durham DH6 5AZ

| Today | See what it's worth now |
| 6 Feb 2026 | £77,000 |
| 21 Dec 2018 | £70,000 |
9, Brockwell Street, Durham DH6 5NA
| Today | See what it's worth now |
| 16 Jan 2026 | £135,000 |
| 30 Jul 2021 | £115,000 |
129, Grange Way, Durham DH6 5PL
| Today | See what it's worth now |
| 18 Dec 2025 | £266,000 |
| 22 Jun 2018 | £214,950 |
No other historical records.
25, Bede Terrace, Durham DH6 5DT
| Today | See what it's worth now |
| 15 Dec 2025 | £97,500 |
| 28 Mar 2024 | £77,500 |
No other historical records.
28, Cavell Drive, Durham DH6 5FE
| Today | See what it's worth now |
| 15 Dec 2025 | £150,000 |
| 15 Dec 2011 | £121,995 |
No other historical records.
78, Runcie Road, Durham DH6 5EY
| Today | See what it's worth now |
| 10 Dec 2025 | £134,000 |
| 21 Sep 2010 | £59,383 |
15, Bow Street, Bowburn DH6 5AL
| Today | See what it's worth now |
| 10 Dec 2025 | £66,000 |
No other historical records.
91, Wheatley Close, Bowburn DH6 5FU
| Today | See what it's worth now |
| 10 Dec 2025 | £263,500 |
| 4 Aug 2023 | £244,995 |
No other historical records.
6, Broadmeadows, Durham DH6 5DA
| Today | See what it's worth now |
| 9 Dec 2025 | £240,000 |
| 12 Apr 2007 | £155,000 |
No other historical records.
24, Oakfield Crescent, Durham DH6 5DF
| Today | See what it's worth now |
| 9 Dec 2025 | £183,000 |
| 25 Apr 2019 | £140,000 |
Source Acknowledgement: © Crown copyright. England and Wales house price data is publicly available information produced by the HM Land Registry.This material was last updated on 9 July 2026. It covers the period from 1 January 1995 to 30 April 2026 and contains property transactions which have been registered during that period. Contains HM Land Registry data © Crown copyright and database right 2026. This data is licensed under the Open Government Licence v3.0.
Disclaimer: Rightmove.co.uk provides this HM Land Registry data "as is". The burden for fitness of the data relies completely with the user and is provided for informational purposes only. No warranty, express or implied, is given relating to the accuracy of content of the HM Land Registry data and Rightmove does not accept any liability for error or omission. If you have found an error with the data or need further information please contact HM Land Registry.
Permitted Use: Viewers of this Information are granted permission to access this Crown copyright material and to download it onto electronic, magnetic, optical or similar storage media provided that such activities are for private research, study or in-house use only. Any other use of the material requires the formal written permission of Land Registry which can be requested from us, and is subject to an additional licence and associated charge.
Rightmove takes no liability for your use of, or reliance on, Rightmove's Instant Valuation due to the limitations of our tracking tool listed here. Use of this tool is taken entirely at your own risk. All rights reserved.