
House Prices in Bradway
House prices in Bradway have an overall average of £404,033 over the last year.
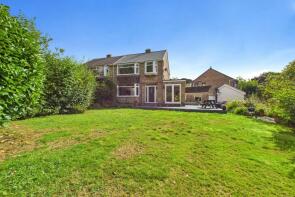
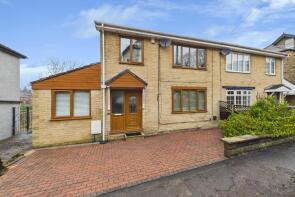
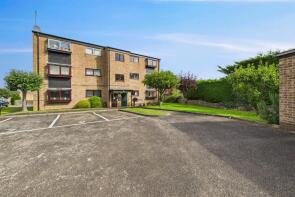
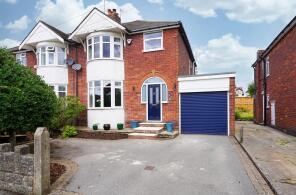
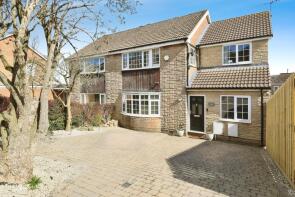
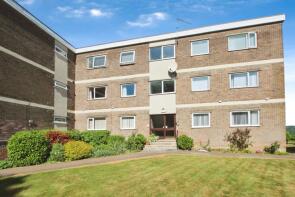
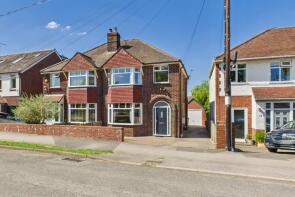
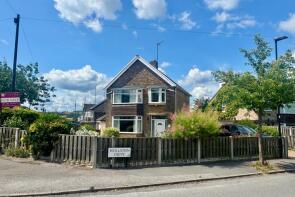
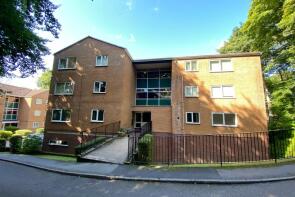
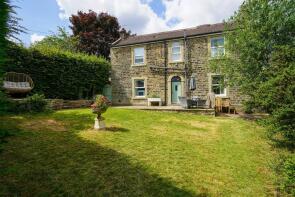
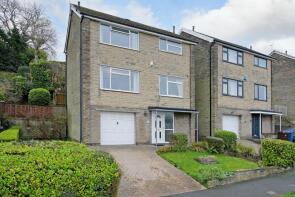
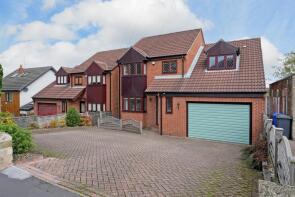
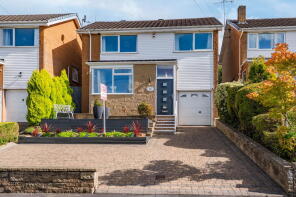
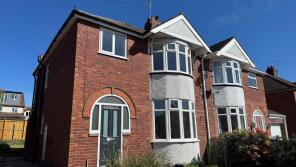
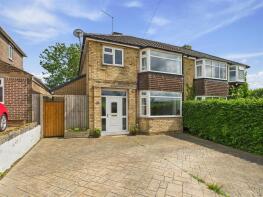
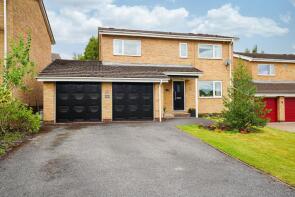
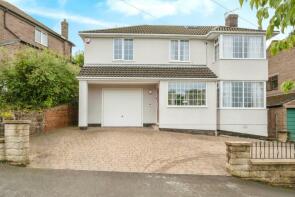
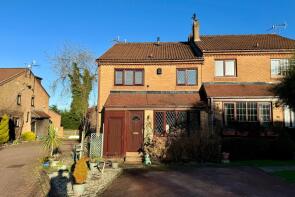
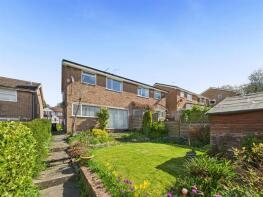
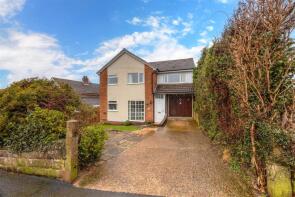
The majority of properties sold in Bradway during the last year were detached properties, selling for an average price of £473,495. Semi-detached properties sold for an average of £391,808, with flats fetching £186,400.
Overall, the historical sold prices in Bradway over the last year were 5% down on the previous year and 2% up on the 2023 peak of £397,474.
Properties Sold
54, Longford Road, Sheffield S17 4LQ
| Today | See what it's worth now |
| 27 Apr 2026 | £382,000 |
| 17 Feb 2021 | £313,500 |
45, Queen Victoria Road, Sheffield S17 4HT
| Today | See what it's worth now |
| 27 Apr 2026 | £322,000 |
| 16 Nov 2015 | £198,000 |
Flat 9, 83 Derwent Court, Everard Avenue, Sheffield S17 4ND
| Today | See what it's worth now |
| 14 Apr 2026 | £156,000 |
| 3 Dec 2004 | £102,000 |
No other historical records.
32, Conalan Avenue, Sheffield S17 4PG
| Today | See what it's worth now |
| 30 Mar 2026 | £400,000 |
| 25 Jan 2019 | £290,000 |
33, Everard Drive, Sheffield S17 4NE
| Today | See what it's worth now |
| 19 Mar 2026 | £475,000 |
| 21 Aug 2020 | £368,000 |
21, Moorview Court, Bradway Drive, Sheffield S17 4PD
| Today | See what it's worth now |
| 13 Mar 2026 | £210,000 |
| 14 Aug 2015 | £187,500 |
12, Totley Lane, Sheffield S17 4PB
| Today | See what it's worth now |
| 11 Mar 2026 | £425,000 |
| 27 Sep 2018 | £260,000 |
No other historical records.
24, Wollaton Road, Sheffield S17 4LE
| Today | See what it's worth now |
| 10 Mar 2026 | £335,000 |
No other historical records.
Flat 1, 20 Hallam Court, Twentywell Lane, Sheffield S17 4QD
| Today | See what it's worth now |
| 10 Mar 2026 | £130,000 |
| 2 Feb 2007 | £110,000 |
No other historical records.
60 Bradway House, Prospect Road, Bradway, Sheffield S17 4JD
| Today | See what it's worth now |
| 20 Feb 2026 | £590,000 |
| 15 Dec 2020 | £495,000 |
No other historical records.
1, Poynton Wood Crescent, Sheffield S17 4NB
| Today | See what it's worth now |
| 19 Feb 2026 | £540,000 |
| 4 Jul 2014 | £325,000 |
37, St Quentin Drive, Sheffield S17 4PN
| Today | See what it's worth now |
| 18 Feb 2026 | £425,000 |
No other historical records.
118, Prospect Road, Bradway, Sheffield S17 4JE
| Today | See what it's worth now |
| 13 Feb 2026 | £510,000 |
| 13 Aug 2004 | £260,000 |
21, Prospect Drive, Sheffield S17 4JH
| Today | See what it's worth now |
| 6 Feb 2026 | £360,000 |
| 17 Aug 2007 | £199,950 |
No other historical records.
30, Conalan Avenue, Sheffield S17 4PG
| Today | See what it's worth now |
| 4 Feb 2026 | £360,000 |
No other historical records.
109, Wollaton Road, Sheffield S17 4LF
| Today | See what it's worth now |
| 28 Jan 2026 | £385,000 |
| 10 Oct 2014 | £224,000 |
44, Everard Avenue, Sheffield S17 4LZ
| Today | See what it's worth now |
| 28 Jan 2026 | £547,000 |
| 8 Nov 2017 | £345,000 |
No other historical records.
6, St Quentin Drive, Sheffield S17 4PP
| Today | See what it's worth now |
| 13 Jan 2026 | £520,000 |
| 14 Dec 2016 | £340,000 |
3, Castlerow View, Sheffield S17 4RD
| Today | See what it's worth now |
| 9 Jan 2026 | £725,000 |
| 17 Nov 2006 | £519,950 |
No other historical records.
44, Queen Victoria Road, Sheffield S17 4HT
| Today | See what it's worth now |
| 18 Dec 2025 | £600,000 |
| 29 Sep 2023 | £303,000 |
No other historical records.
9, Celandine Court, Sheffield S17 4JL
| Today | See what it's worth now |
| 17 Dec 2025 | £172,500 |
No other historical records.
188, Twentywell Lane, Sheffield S17 4QF
| Today | See what it's worth now |
| 5 Dec 2025 | £278,500 |
| 13 Nov 1998 | £68,750 |
No other historical records.
80, Queen Victoria Road, Sheffield S17 4HU

| Today | See what it's worth now |
| 24 Nov 2025 | £565,635 |
| 8 Jun 2015 | £481,000 |

Source Acknowledgement: © Crown copyright. England and Wales house price data is publicly available information produced by the HM Land Registry.This material was last updated on 9 July 2026. It covers the period from 1 January 1995 to 30 April 2026 and contains property transactions which have been registered during that period. Contains HM Land Registry data © Crown copyright and database right 2026. This data is licensed under the Open Government Licence v3.0.
Disclaimer: Rightmove.co.uk provides this HM Land Registry data "as is". The burden for fitness of the data relies completely with the user and is provided for informational purposes only. No warranty, express or implied, is given relating to the accuracy of content of the HM Land Registry data and Rightmove does not accept any liability for error or omission. If you have found an error with the data or need further information please contact HM Land Registry.
Permitted Use: Viewers of this Information are granted permission to access this Crown copyright material and to download it onto electronic, magnetic, optical or similar storage media provided that such activities are for private research, study or in-house use only. Any other use of the material requires the formal written permission of Land Registry which can be requested from us, and is subject to an additional licence and associated charge.
Rightmove takes no liability for your use of, or reliance on, Rightmove's Instant Valuation due to the limitations of our tracking tool listed here. Use of this tool is taken entirely at your own risk. All rights reserved.