
House Prices in Bradwell Common
House prices in Bradwell Common have an overall average of £370,773 over the last year.
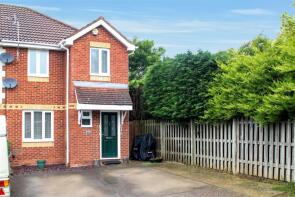
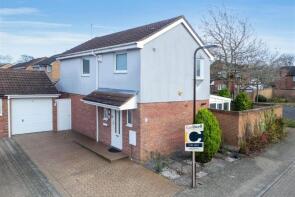
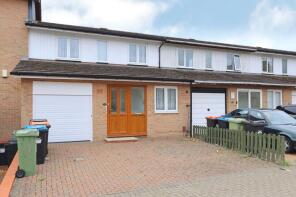
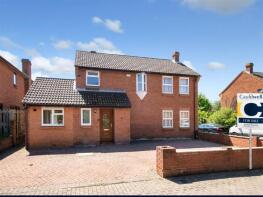
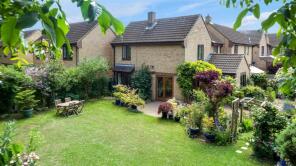
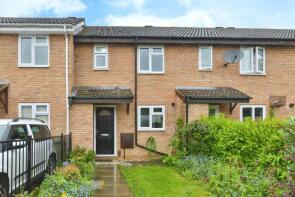
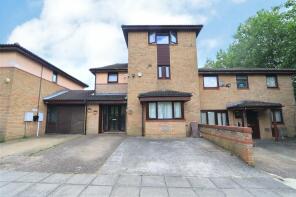
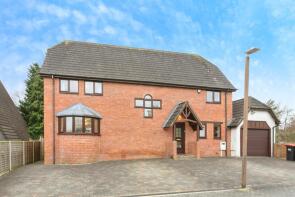
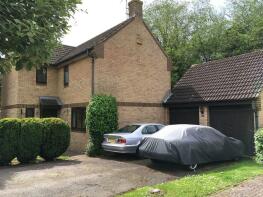
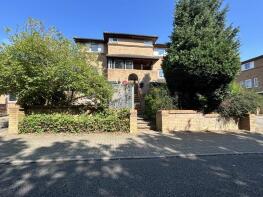
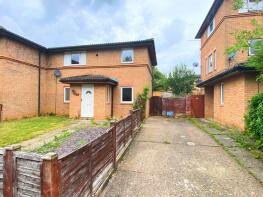
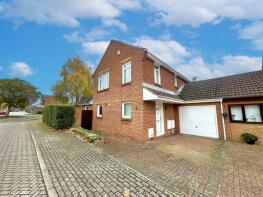
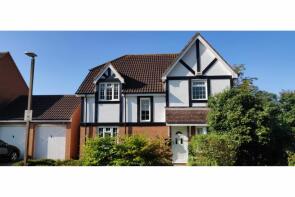
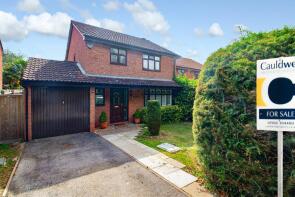
The majority of properties sold in Bradwell Common during the last year were detached properties, selling for an average price of £455,900. Terraced properties sold for an average of £276,000, with semi-detached properties fetching £347,500.
Overall, the historical sold prices in Bradwell Common over the last year were 3% up on the previous year and 8% up on the 2023 peak of £344,550.
Properties Sold
56, Brill Place, Bradwell Common, Milton Keynes MK13 8LR
| Today | See what it's worth now |
| 26 Mar 2026 | £315,000 |
| 2 Aug 2002 | £128,000 |
8, Stokenchurch Place, Bradwell Common, Milton Keynes MK13 8AT
| Today | See what it's worth now |
| 24 Mar 2026 | £390,000 |
| 21 Dec 2015 | £289,995 |
No other historical records.
8, Plumstead Avenue, Bradwell Common, Milton Keynes MK13 8AF
| Today | See what it's worth now |
| 5 Mar 2026 | £390,000 |
| 2 Jul 2013 | £169,000 |
50, Coleshill Place, Bradwell Common, Milton Keynes MK13 8DP
| Today | See what it's worth now |
| 24 Feb 2026 | £600,000 |
| 4 Sep 2014 | £379,995 |
10, Wandsworth Place, Bradwell Common, Milton Keynes MK13 8BT
| Today | See what it's worth now |
| 13 Feb 2026 | £285,000 |
No other historical records.
105, Bradwell Common Boulevard, Bradwell Common, Milton Keynes MK13 8DY
| Today | See what it's worth now |
| 19 Jan 2026 | £184,000 |
| 18 Apr 2005 | £115,000 |
5, Stokenchurch Place, Bradwell Common, Milton Keynes MK13 8AN
| Today | See what it's worth now |
| 14 Jan 2026 | £429,500 |
| 3 Nov 2006 | £235,000 |
104, Booker Avenue, Bradwell Common, Milton Keynes MK13 8EF
| Today | See what it's worth now |
| 29 Oct 2025 | £445,000 |
| 8 Jun 2001 | £141,000 |
No other historical records.
29, Booker Avenue, Bradwell Common, Milton Keynes MK13 8AY
| Today | See what it's worth now |
| 8 Sep 2025 | £245,000 |
No other historical records.
25, Ibstone Avenue, Bradwell Common, Milton Keynes MK13 8EA
| Today | See what it's worth now |
| 18 Jul 2025 | £415,000 |
| 29 Aug 2014 | £238,500 |
126, Bradwell Common Boulevard, Bradwell Common, Milton Keynes MK13 8EZ
| Today | See what it's worth now |
| 4 Jul 2025 | £380,000 |
| 9 Feb 2017 | £295,000 |
19, Coleshill Place, Bradwell Common, Milton Keynes MK13 8DG
| Today | See what it's worth now |
| 27 Jun 2025 | £565,000 |
| 31 Jul 2014 | £320,000 |
53, Booker Avenue, Bradwell Common, Milton Keynes MK13 8EG
| Today | See what it's worth now |
| 16 May 2025 | £517,500 |
No other historical records.
73, Bradwell Common Boulevard, Bradwell Common, Milton Keynes MK13 8EH
| Today | See what it's worth now |
| 16 May 2025 | £60,000 |
No other historical records.
67, Bradwell Common Boulevard, Bradwell Common, Milton Keynes MK13 8EH
| Today | See what it's worth now |
| 16 May 2025 | £170,000 |
| 23 May 2012 | £82,000 |
8, Booker Avenue, Bradwell Common, Milton Keynes MK13 8AP
| Today | See what it's worth now |
| 30 Apr 2025 | £415,000 |
| 25 Jun 2002 | £165,000 |
25, Booker Avenue, Bradwell Common, Milton Keynes MK13 8AY

| Today | See what it's worth now |
| 21 Mar 2025 | £373,000 |
No other historical records.
41, Mayditch Place, Bradwell Common, Milton Keynes MK13 8LY
| Today | See what it's worth now |
| 18 Mar 2025 | £580,000 |
| 17 May 2016 | £405,000 |
30, Clapham Place, Bradwell Common, Milton Keynes MK13 8ET
| Today | See what it's worth now |
| 11 Mar 2025 | £250,000 |
| 28 Feb 2003 | £143,500 |
No other historical records.
14, Ibstone Avenue, Bradwell Common, Milton Keynes MK13 8BD
| Today | See what it's worth now |
| 28 Feb 2025 | £401,000 |
| 27 May 2022 | £380,000 |
86, Eelbrook Avenue, Bradwell Common, Milton Keynes MK13 8RB
| Today | See what it's worth now |
| 24 Feb 2025 | £462,500 |
| 11 Jun 1999 | £105,000 |
34, Ibstone Avenue, Bradwell Common, Milton Keynes MK13 8ED
| Today | See what it's worth now |
| 21 Feb 2025 | £428,000 |
No other historical records.
43, Hadley Place, Bradwell Common, Milton Keynes MK13 8DS
| Today | See what it's worth now |
| 30 Jan 2025 | £122,500 |
| 15 Mar 2019 | £110,000 |
Source Acknowledgement: © Crown copyright. England and Wales house price data is publicly available information produced by the HM Land Registry.This material was last updated on 9 July 2026. It covers the period from 1 January 1995 to 30 April 2026 and contains property transactions which have been registered during that period. Contains HM Land Registry data © Crown copyright and database right 2026. This data is licensed under the Open Government Licence v3.0.
Disclaimer: Rightmove.co.uk provides this HM Land Registry data "as is". The burden for fitness of the data relies completely with the user and is provided for informational purposes only. No warranty, express or implied, is given relating to the accuracy of content of the HM Land Registry data and Rightmove does not accept any liability for error or omission. If you have found an error with the data or need further information please contact HM Land Registry.
Permitted Use: Viewers of this Information are granted permission to access this Crown copyright material and to download it onto electronic, magnetic, optical or similar storage media provided that such activities are for private research, study or in-house use only. Any other use of the material requires the formal written permission of Land Registry which can be requested from us, and is subject to an additional licence and associated charge.
Rightmove takes no liability for your use of, or reliance on, Rightmove's Instant Valuation due to the limitations of our tracking tool listed here. Use of this tool is taken entirely at your own risk. All rights reserved.