
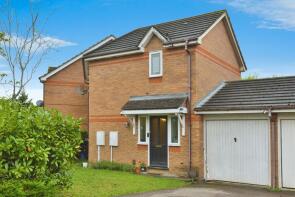
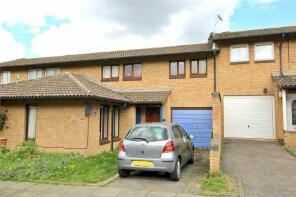
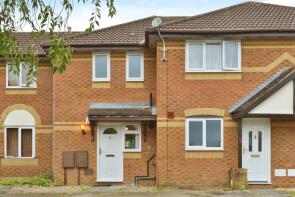
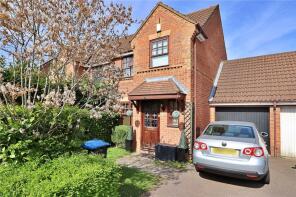
House Prices in Oldbrook
House prices in Oldbrook have an overall average of £275,760 over the last year.
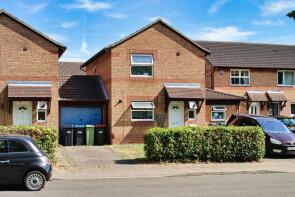
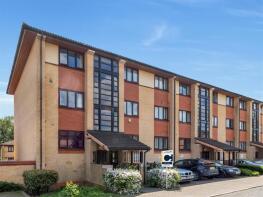
The majority of properties sold in Oldbrook during the last year were semi-detached properties, selling for an average price of £332,833. Terraced properties sold for an average of £231,471, with detached properties fetching £376,667.
Overall, the historical sold prices in Oldbrook over the last year were 4% up on the previous year and similar to the 2021 peak of £277,124.
Properties Sold
88, Oldbrook Boulevard, Oldbrook, Milton Keynes MK6 2JD
| Today | See what it's worth now |
| 7 Apr 2026 | £380,000 |
| 17 Sep 1999 | £78,500 |
8e, Boycott Avenue, Oldbrook, Milton Keynes MK6 2JX
| Today | See what it's worth now |
| 13 Mar 2026 | £123,000 |
| 4 Jul 2018 | £120,000 |
56, Kirkstall Place, Oldbrook, Milton Keynes MK6 2ND
| Today | See what it's worth now |
| 27 Feb 2026 | £175,000 |
| 24 Jun 2016 | £167,000 |
80, The Boundary, Oldbrook, Milton Keynes MK6 2HW

| Today | See what it's worth now |
| 12 Feb 2026 | £401,000 |
| 24 Nov 2006 | £200,000 |
No other historical records.
104, Oldbrook Boulevard, Oldbrook, Milton Keynes MK6 2JD

| Today | See what it's worth now |
| 30 Jan 2026 | £365,000 |
| 17 Apr 2003 | £162,000 |
No other historical records.
31, Shackleton Place, Oldbrook, Milton Keynes MK6 2PY
| Today | See what it's worth now |
| 30 Dec 2025 | £76,500 |
| 3 Jul 2015 | £60,000 |
17, Arlott Crescent, Oldbrook, Milton Keynes MK6 2QL
| Today | See what it's worth now |
| 19 Dec 2025 | £115,000 |
| 7 Jul 2000 | £38,000 |
6, Bridgeford Court, Oldbrook, Milton Keynes MK6 2NA
| Today | See what it's worth now |
| 8 Dec 2025 | £225,000 |
| 1 Sep 2008 | £175,000 |
No other historical records.
211, Arlott Crescent, Oldbrook, Milton Keynes MK6 2QT
| Today | See what it's worth now |
| 5 Dec 2025 | £180,000 |
| 23 Jun 2006 | £129,000 |
7, Sutcliffe Avenue, Oldbrook, Milton Keynes MK6 2PA
| Today | See what it's worth now |
| 24 Nov 2025 | £142,500 |
| 12 Mar 2002 | £63,500 |
No other historical records.
16, Ulyett Place, Oldbrook, Milton Keynes MK6 2NE
| Today | See what it's worth now |
| 24 Nov 2025 | £301,500 |
| 13 Apr 2005 | £148,000 |
11, Statham Place, Oldbrook, Milton Keynes MK6 2HB
| Today | See what it's worth now |
| 20 Nov 2025 | £395,000 |
| 26 Oct 2012 | £190,000 |
110, Brearley Avenue, Oldbrook, Milton Keynes MK6 2UG
| Today | See what it's worth now |
| 17 Nov 2025 | £275,000 |
| 6 Nov 2019 | £210,000 |
14, The Boundary, Oldbrook, Milton Keynes MK6 2HA
| Today | See what it's worth now |
| 31 Oct 2025 | £337,000 |
| 20 Dec 2002 | £163,000 |
27, Hutton Avenue, Oldbrook, Milton Keynes MK6 2QG

| Today | See what it's worth now |
| 30 Oct 2025 | £368,000 |
| 26 Oct 2018 | £277,500 |
No other historical records.
15, Underwood Place, Oldbrook, Milton Keynes MK6 2NJ

| Today | See what it's worth now |
| 24 Oct 2025 | £170,000 |
| 16 Aug 2006 | £160,999 |
No other historical records.
91, Arlott Crescent, Oldbrook, Milton Keynes MK6 2RA

| Today | See what it's worth now |
| 21 Oct 2025 | £460,000 |
| 16 Nov 2001 | £129,000 |
No other historical records.
42, Rhodes Place, Oldbrook, Milton Keynes MK6 2LY
| Today | See what it's worth now |
| 1 Oct 2025 | £315,000 |
| 20 Apr 2015 | £209,000 |
24, Kirkstall Place, Oldbrook, Milton Keynes MK6 2NB
| Today | See what it's worth now |
| 24 Sep 2025 | £315,000 |
| 31 Aug 2006 | £160,000 |
33, Brearley Avenue, Oldbrook, Milton Keynes MK6 2UA
| Today | See what it's worth now |
| 17 Sep 2025 | £92,000 |
| 6 May 2003 | £51,999 |
16, Grace Avenue, Oldbrook, Milton Keynes MK6 2XN
| Today | See what it's worth now |
| 10 Sep 2025 | £358,000 |
| 9 Dec 2015 | £239,995 |
180, Oldbrook Boulevard, Oldbrook, Milton Keynes MK6 2HG
| Today | See what it's worth now |
| 21 Aug 2025 | £340,000 |
No other historical records.
84, The Boundary, Oldbrook, Milton Keynes MK6 2HW

| Today | See what it's worth now |
| 8 Aug 2025 | £390,000 |
No other historical records.
Source Acknowledgement: © Crown copyright. England and Wales house price data is publicly available information produced by the HM Land Registry.This material was last updated on 9 July 2026. It covers the period from 1 January 1995 to 30 April 2026 and contains property transactions which have been registered during that period. Contains HM Land Registry data © Crown copyright and database right 2026. This data is licensed under the Open Government Licence v3.0.
Disclaimer: Rightmove.co.uk provides this HM Land Registry data "as is". The burden for fitness of the data relies completely with the user and is provided for informational purposes only. No warranty, express or implied, is given relating to the accuracy of content of the HM Land Registry data and Rightmove does not accept any liability for error or omission. If you have found an error with the data or need further information please contact HM Land Registry.
Permitted Use: Viewers of this Information are granted permission to access this Crown copyright material and to download it onto electronic, magnetic, optical or similar storage media provided that such activities are for private research, study or in-house use only. Any other use of the material requires the formal written permission of Land Registry which can be requested from us, and is subject to an additional licence and associated charge.
Rightmove takes no liability for your use of, or reliance on, Rightmove's Instant Valuation due to the limitations of our tracking tool listed here. Use of this tool is taken entirely at your own risk. All rights reserved.