
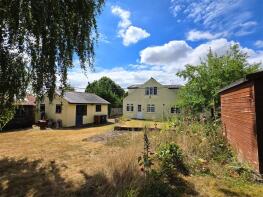
House Prices in Braughing
House prices in Braughing have an overall average of £698,944 over the last year.
The majority of properties sold in Braughing during the last year were detached properties, selling for an average price of £814,500. Semi-detached properties sold for an average of £681,000, with flats fetching £175,000.
Overall, the historical sold prices in Braughing over the last year were 5% up on the previous year and 18% down on the 2020 peak of £847,560.
Properties Sold
2, Green Hill Close, Ware SG11 2PX
| Today | See what it's worth now |
| 30 Jan 2026 | £175,000 |
| 30 Jul 2021 | £143,000 |
No other historical records.
8, The Bungalow, Hay Street, Braughing SG11 2RJ
| Today | See what it's worth now |
| 14 Nov 2025 | £720,000 |
No other historical records.
32, Green Lane, Ware SG11 2QW
| Today | See what it's worth now |
| 5 Nov 2025 | £515,000 |
| 15 Feb 2002 | £165,000 |
No other historical records.
54, Green Lane, Ware SG11 2QW
| Today | See what it's worth now |
| 30 Oct 2025 | £590,000 |
| 29 Oct 2010 | £272,000 |
No other historical records.
4 Westwood, Hull Lane, Ware SG11 2PF
| Today | See what it's worth now |
| 24 Oct 2025 | £680,000 |
| 21 Jun 1996 | £173,000 |
No other historical records.
Haywood, Hay Street, Ware SG11 2RJ
| Today | See what it's worth now |
| 5 Sep 2025 | £860,000 |
| 1 Jun 2018 | £487,500 |
18, The Street, Ware SG11 2QF
| Today | See what it's worth now |
| 15 Aug 2025 | £938,000 |
No other historical records.
4, Rose Meadow, Dassels, Ware SG11 2RS
| Today | See what it's worth now |
| 28 Jul 2025 | £825,000 |
| 22 Oct 2019 | £670,000 |
No other historical records.
Meadowview, Hull Lane, Braughing SG11 2PF
| Today | See what it's worth now |
| 4 Jul 2025 | £987,500 |
No other historical records.
10 Greenhill Cottage, Ford Street, Ware SG11 2PW
| Today | See what it's worth now |
| 27 Jun 2025 | £510,000 |
No other historical records.
7, Halls Close, Braughing SG11 2EA
| Today | See what it's worth now |
| 24 Apr 2025 | £622,500 |
No other historical records.
12, Pelham Road, Braughing SG11 2QU
| Today | See what it's worth now |
| 31 Mar 2025 | £725,000 |
No other historical records.
17 St Annes, Green End, Ware SG11 2PG
| Today | See what it's worth now |
| 26 Mar 2025 | £1,075,000 |
| 20 Feb 2018 | £845,000 |
52, Green End, Ware SG11 2PQ
| Today | See what it's worth now |
| 16 Dec 2024 | £610,000 |
| 19 Jul 2019 | £510,000 |
No other historical records.
3, Hull Lane, Braughing SG11 2PF
| Today | See what it's worth now |
| 13 Dec 2024 | £545,000 |
No other historical records.
50a Tenon Lodge, Green End, Ware SG11 2PQ
| Today | See what it's worth now |
| 12 Dec 2024 | £550,000 |
| 6 Nov 2017 | £515,000 |
22, Friars Road, Braughing SG11 2NN
| Today | See what it's worth now |
| 4 Nov 2024 | £735,000 |
No other historical records.
4 Birchwood Lodge, Saffron Ground Gardens, Ware SG11 2BJ
| Today | See what it's worth now |
| 31 Oct 2024 | £1,088,500 |
| 18 Nov 2020 | £1,100,000 |
No other historical records.
Martins Nest, Friars Road, Braughing SG11 2NR

| Today | See what it's worth now |
| 14 Oct 2024 | £500,000 |
No other historical records.
Woodpeckers, Friars Road, Braughing SG11 2NR
| Today | See what it's worth now |
| 14 Oct 2024 | £600,000 |
No other historical records.
5, Southfield, Ware SG11 2QH

| Today | See what it's worth now |
| 12 Jul 2024 | £380,000 |
| 23 May 2013 | £245,000 |
9 Ward House, Pound Close, Ware SG11 2BH

| Today | See what it's worth now |
| 24 Jun 2024 | £690,000 |
| 27 Apr 2012 | £545,000 |
No other historical records.
13, Green Lane, Ware SG11 2QN
| Today | See what it's worth now |
| 29 Feb 2024 | £490,000 |
| 23 Feb 2022 | £474,000 |
Source Acknowledgement: © Crown copyright. England and Wales house price data is publicly available information produced by the HM Land Registry.This material was last updated on 9 July 2026. It covers the period from 1 January 1995 to 30 April 2026 and contains property transactions which have been registered during that period. Contains HM Land Registry data © Crown copyright and database right 2026. This data is licensed under the Open Government Licence v3.0.
Disclaimer: Rightmove.co.uk provides this HM Land Registry data "as is". The burden for fitness of the data relies completely with the user and is provided for informational purposes only. No warranty, express or implied, is given relating to the accuracy of content of the HM Land Registry data and Rightmove does not accept any liability for error or omission. If you have found an error with the data or need further information please contact HM Land Registry.
Permitted Use: Viewers of this Information are granted permission to access this Crown copyright material and to download it onto electronic, magnetic, optical or similar storage media provided that such activities are for private research, study or in-house use only. Any other use of the material requires the formal written permission of Land Registry which can be requested from us, and is subject to an additional licence and associated charge.
Rightmove takes no liability for your use of, or reliance on, Rightmove's Instant Valuation due to the limitations of our tracking tool listed here. Use of this tool is taken entirely at your own risk. All rights reserved.