
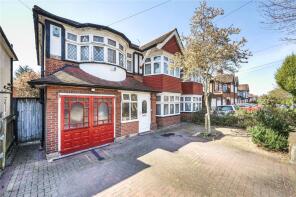
House Prices in Brent
House prices in Brent have an overall average of £519,522 over the last year.
The majority of properties sold in Brent during the last year were flats, selling for an average price of £332,334. Semi-detached properties sold for an average of £697,349, with terraced properties fetching £534,309.
Overall, the historical sold prices in Brent over the last year were 6% down on the previous year and similar to the 2023 peak of £520,786.
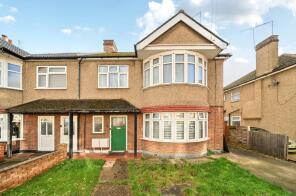
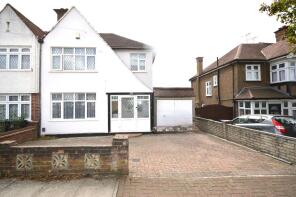
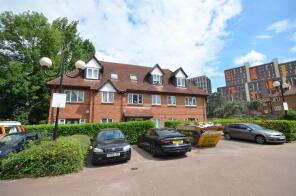
Properties Sold
11, Shaftesbury Avenue, Harrow HA3 0QT
| Today | See what it's worth now |
| 24 Apr 2026 | £825,000 |
| 18 Mar 2003 | £420,000 |
No other historical records.
8, The Leys, Harrow HA3 9SP
| Today | See what it's worth now |
| 17 Apr 2026 | £612,000 |
| 25 Jun 2021 | £825,000 |
26, Eversley Avenue, Wembley HA9 9JZ
| Today | See what it's worth now |
| 16 Apr 2026 | £900,000 |
| 5 Jul 1995 | £147,500 |
No other historical records.
55, Chamberlayne Avenue, Wembley HA9 8SR
| Today | See what it's worth now |
| 10 Apr 2026 | £250,000 |
| 26 Jun 2000 | £124,995 |
No other historical records.
27, 4 Padfield Court, Forty Avenue, Wembley HA9 8JS
| Today | See what it's worth now |
| 8 Apr 2026 | £95,000 |
| 15 Sep 2015 | £167,000 |
26, 81 Newland Court, Forty Avenue, Wembley HA9 9LZ
| Today | See what it's worth now |
| 2 Apr 2026 | £230,000 |
| 10 Jun 2011 | £167,000 |
3, Bulmer Gardens, Harrow HA3 0PA
| Today | See what it's worth now |
| 1 Apr 2026 | £940,000 |
| 28 Nov 2005 | £395,000 |
No other historical records.
6, The Crossways, Wembley HA9 9LB
| Today | See what it's worth now |
| 30 Mar 2026 | £870,000 |
| 12 Apr 2021 | £800,000 |
40, Barn Way, Wembley HA9 9NW

| Today | See what it's worth now |
| 30 Mar 2026 | £1,100,000 |
| 19 Jun 2018 | £735,000 |
69a, Woodgrange Avenue, Harrow HA3 0XG
| Today | See what it's worth now |
| 27 Mar 2026 | £352,000 |
No other historical records.
6, Rydal Gardens, Wembley HA9 8RZ
| Today | See what it's worth now |
| 27 Mar 2026 | £640,000 |
| 20 Jan 1997 | £116,000 |
No other historical records.
Flat 172, 33 Marathon House, Olympic Way, Wembley HA9 0GF

| Today | See what it's worth now |
| 20 Mar 2026 | £385,000 |
| 28 Jun 2021 | £380,000 |
14, 85 The Gables, Manor Drive, Wembley HA9 8DJ
| Today | See what it's worth now |
| 20 Mar 2026 | £308,000 |
| 6 Mar 1997 | £69,950 |
No other historical records.
8, Vivian Gardens, Wembley HA9 6RF

| Today | See what it's worth now |
| 18 Mar 2026 | £590,000 |
| 15 Aug 1995 | £82,000 |
No other historical records.
69, West Hill, Wembley HA9 9RP
| Today | See what it's worth now |
| 17 Mar 2026 | £850,000 |
| 28 Feb 2014 | £710,000 |
No other historical records.
6, Bell House, Hirst Crescent, Wembley HA9 7HE

| Today | See what it's worth now |
| 17 Mar 2026 | £130,000 |
| 22 Oct 2019 | £128,000 |
125, Clarendon Gardens, Wembley HA9 7LF
| Today | See what it's worth now |
| 5 Mar 2026 | £345,000 |
| 10 Sep 2021 | £305,000 |
44, Dagmar Avenue, Wembley HA9 8DF
| Today | See what it's worth now |
| 3 Mar 2026 | £520,000 |
| 28 Jul 2006 | £260,000 |
No other historical records.
29, Lambert Walk, Wembley HA9 7TR
| Today | See what it's worth now |
| 27 Feb 2026 | £530,000 |
| 15 Nov 2006 | £217,500 |
No other historical records.
38, Carlton Avenue East, Wembley HA9 8LX
| Today | See what it's worth now |
| 26 Feb 2026 | £720,000 |
No other historical records.
243, Harrow Road, Wembley HA9 6DX
| Today | See what it's worth now |
| 20 Feb 2026 | £347,500 |
| 8 Aug 2001 | £105,000 |
No other historical records.
Flat 31, Elizabeth House, High Road, Wembley HA9 6BF
| Today | See what it's worth now |
| 18 Feb 2026 | £375,000 |
No other historical records.
Flat 6, 308, Preston Road, Harrow HA3 0QA

| Today | See what it's worth now |
| 17 Feb 2026 | £325,000 |
| 29 May 2015 | £335,000 |
No other historical records.

Source Acknowledgement: © Crown copyright. England and Wales house price data is publicly available information produced by the HM Land Registry.This material was last updated on 9 July 2026. It covers the period from 1 January 1995 to 30 April 2026 and contains property transactions which have been registered during that period. Contains HM Land Registry data © Crown copyright and database right 2026. This data is licensed under the Open Government Licence v3.0.
Disclaimer: Rightmove.co.uk provides this HM Land Registry data "as is". The burden for fitness of the data relies completely with the user and is provided for informational purposes only. No warranty, express or implied, is given relating to the accuracy of content of the HM Land Registry data and Rightmove does not accept any liability for error or omission. If you have found an error with the data or need further information please contact HM Land Registry.
Permitted Use: Viewers of this Information are granted permission to access this Crown copyright material and to download it onto electronic, magnetic, optical or similar storage media provided that such activities are for private research, study or in-house use only. Any other use of the material requires the formal written permission of Land Registry which can be requested from us, and is subject to an additional licence and associated charge.
Rightmove takes no liability for your use of, or reliance on, Rightmove's Instant Valuation due to the limitations of our tracking tool listed here. Use of this tool is taken entirely at your own risk. All rights reserved.