
House Prices in Brickendon Liberty
House prices in Brickendon Liberty have an overall average of £724,272 over the last year.
The majority of properties sold in Brickendon Liberty during the last year were flats, selling for an average price of £292,923. Detached properties sold for an average of £1,236,417, with terraced properties fetching £730,417.
Overall, the historical sold prices in Brickendon Liberty over the last year were 11% up on the previous year and 9% down on the 2023 peak of £798,974.
Properties Sold
4, Glovers Close, Hertford SG13 8DT
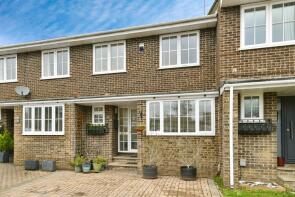
| Today | See today's value |
| 10 Aug 2026 | £535,000 |
| 17 Apr 2008 | £335,000 |
6, Kinsman Mews, Hertford SG13 8EW
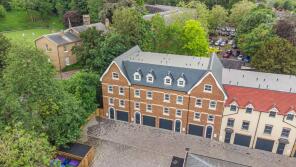
| Today | See today's value |
| 21 Jul 2026 | £820,000 |
No other historical records.
17, Stockings Lane, Little Berkhamsted SG13 8LW
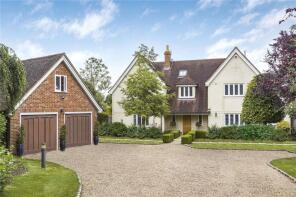
| Today | See today's value |
| 3 Jul 2026 | £1,850,000 |
No other historical records.
16, Ashbourne Gardens, Hertford SG13 8BQ
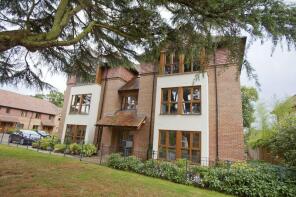
| Today | See today's value |
| 19 Jun 2026 | £267,500 |
| 12 Jan 2015 | £250,000 |
No other historical records.
10, Brickendon Green, Hertford SG13 8PB

| Today | See today's value |
| 26 May 2026 | £670,000 |
| 30 May 2022 | £625,000 |
24, Bullocks Lane, Hertford SG13 8DB
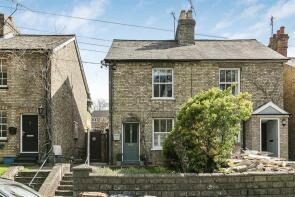
| Today | See today's value |
| 22 May 2026 | £500,000 |
| 4 May 2021 | £465,000 |
5, The Coach House, Balls Park, Hertford SG13 8FN

| Today | See today's value |
| 20 May 2026 | £450,000 |
| 24 Jul 2017 | £440,000 |
24c, Church Road, Hertford SG13 8LY
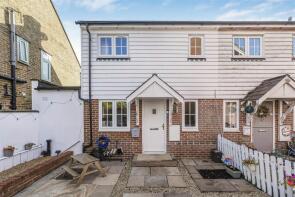
| Today | See today's value |
| 8 May 2026 | £330,000 |
| 30 Sep 2019 | £265,000 |
60, Henmarsh Court, Balls Park, Hertford SG13 8FB
| Today | See today's value |
| 30 Apr 2026 | £352,500 |
| 1 Jun 2022 | £350,000 |
No other historical records.
Sky, Tylers Causeway, Newgate Street, Hertford SG13 8QN
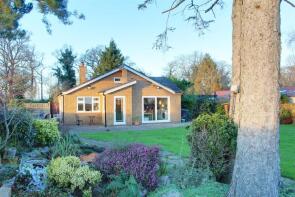
| Today | See today's value |
| 30 Apr 2026 | £920,000 |
| 5 Jul 2002 | £440,000 |
4, Woodcock Lodge, Epping Green SG13 8ND

| Today | See today's value |
| 1 Apr 2026 | £315,000 |
| 11 Jan 2008 | £471,000 |
34, Mandeville Road, Hertford SG13 8JQ
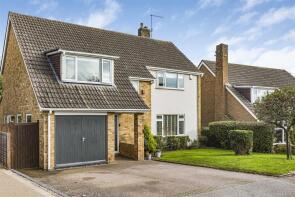
| Today | See today's value |
| 27 Mar 2026 | £1,030,000 |
| 24 Sep 2009 | £500,000 |
No other historical records.
17, Isabella House, Hale Road, Hertford SG13 8EN

| Today | See today's value |
| 20 Mar 2026 | £480,000 |
| 29 Jun 2018 | £510,450 |
No other historical records.
4, Morgans Road, Hertford SG13 8BS
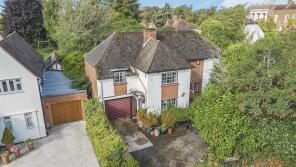
| Today | See today's value |
| 20 Mar 2026 | £1,175,000 |
No other historical records.
20, Queens Road, Hertford SG13 8AZ

| Today | See today's value |
| 18 Mar 2026 | £1,300,000 |
No other historical records.
8, Purkiss Road, Hertford SG13 8JA

| Today | See today's value |
| 13 Mar 2026 | £420,000 |
| 21 Jun 2002 | £154,000 |
No other historical records.
16, Edward House, Pegs Lane, Hertford SG13 8FQ

| Today | See today's value |
| 11 Mar 2026 | £228,000 |
| 31 Aug 2018 | £362,500 |
No other historical records.
30, Queens Road, Hertford SG13 8AZ

| Today | See today's value |
| 6 Mar 2026 | £1,190,000 |
| 10 Jul 2008 | £670,000 |
No other historical records.
7, Noahs Court Gardens, Hertford SG13 8FD

| Today | See today's value |
| 2 Mar 2026 | £850,000 |
| 11 Apr 2017 | £622,500 |
3, Warwick Close, Hertford SG13 8JT

| Today | See today's value |
| 27 Feb 2026 | £850,000 |
No other historical records.
29, Edward House, Pegs Lane, Hertford SG13 8FQ
| Today | See today's value |
| 26 Feb 2026 | £240,000 |
| 31 Oct 2019 | £362,500 |
No other historical records.
37, Edward House, Pegs Lane, Hertford SG13 8FQ

| Today | See today's value |
| 25 Feb 2026 | £270,000 |
| 28 Aug 2018 | £375,000 |
No other historical records.
44, Cecil Road, Hertford SG13 8HR
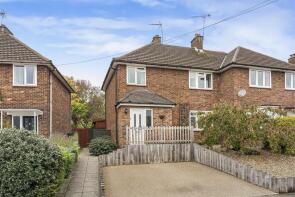
| Today | See today's value |
| 18 Feb 2026 | £545,000 |
No other historical records.


Rightmove takes no liability for your use of, or reliance on, Rightmove's Instant Valuation due to the limitations of our tracking tool listed here. Use of this tool is taken entirely at your own risk. All rights reserved.