
House Prices in Bridge End
House prices in Bridge End have an overall average of £309,174 over the last year.
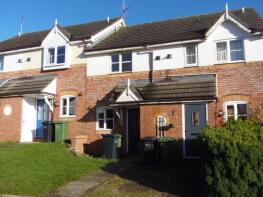
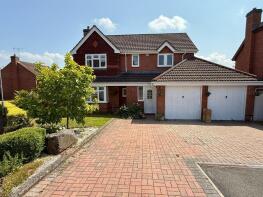
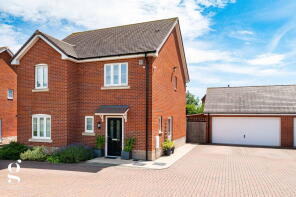
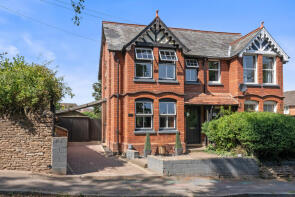
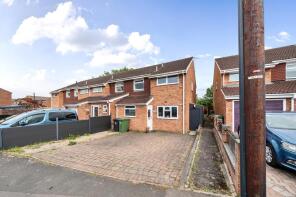
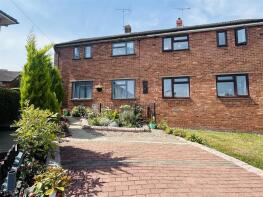
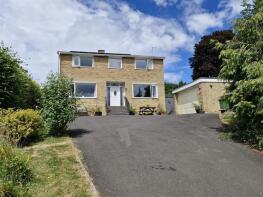
The majority of properties sold in Bridge End during the last year were detached properties, selling for an average price of £418,132. Terraced properties sold for an average of £213,654, with semi-detached properties fetching £269,722.
Overall, the historical sold prices in Bridge End over the last year were 4% down on the previous year and similar to the 2023 peak of £310,418.
Properties Sold
52, York Road, Bromyard HR7 4BG
| Today | See what it's worth now |
| 10 Apr 2026 | £297,000 |
| 19 Jun 2009 | £165,000 |
31, Ash Crescent, Bromyard HR7 4QG
| Today | See what it's worth now |
| 1 Apr 2026 | £183,000 |
| 9 May 2006 | £120,000 |
19, Linton Court, Burley Lane, Bromyard HR7 4QJ
| Today | See what it's worth now |
| 20 Mar 2026 | £60,000 |
| 11 Dec 2014 | £58,000 |
Mulberry Cottage, Norton HR7 4PD
| Today | See what it's worth now |
| 20 Mar 2026 | £670,000 |
| 18 Sep 1997 | £187,000 |
No other historical records.
10, Old Ditch Close, Little Hereford Street, Bromyard HR7 4DE
| Today | See what it's worth now |
| 20 Mar 2026 | £155,000 |
| 15 Aug 2023 | £190,000 |
39, Ash Crescent, Bromyard HR7 4QG
| Today | See what it's worth now |
| 16 Mar 2026 | £155,000 |
| 26 Jan 2005 | £105,000 |
6, Ashfield Way, Bromyard HR7 4BF
| Today | See what it's worth now |
| 24 Feb 2026 | £430,000 |
| 31 Jul 2019 | £280,000 |
27, Woodland View, Bromyard HR7 4HN
| Today | See what it's worth now |
| 19 Feb 2026 | £410,000 |
| 8 Jan 2020 | £310,000 |
No other historical records.
98 Firs Villa, Old Road, Bromyard HR7 4AT
| Today | See what it's worth now |
| 16 Feb 2026 | £295,000 |
| 22 Sep 2022 | £285,000 |
20, Apple Tree Close, Bromyard HR7 4UL

| Today | See what it's worth now |
| 16 Feb 2026 | £410,000 |
| 11 Sep 2020 | £265,000 |
46, Broad Street, Bromyard HR7 4BS
| Today | See what it's worth now |
| 9 Jan 2026 | £197,500 |
No other historical records.
78, Winslow Road, Bromyard HR7 4TN
| Today | See what it's worth now |
| 19 Dec 2025 | £150,000 |
| 8 Aug 1996 | £46,000 |
No other historical records.
81, Winslow Road, Bromyard HR7 4UG
| Today | See what it's worth now |
| 19 Dec 2025 | £240,000 |
| 4 Feb 2021 | £188,000 |
47, Bannut Tree, Bromyard HR7 4AS
| Today | See what it's worth now |
| 17 Dec 2025 | £218,000 |
| 2 Jun 2017 | £130,000 |
No other historical records.
18, Sherford Street, Bromyard HR7 4DL
| Today | See what it's worth now |
| 12 Dec 2025 | £285,000 |
| 9 Jun 2006 | £171,500 |
34 Manameed, Highwell Lane, Bromyard HR7 4DG
| Today | See what it's worth now |
| 12 Dec 2025 | £415,000 |
| 26 Feb 2020 | £385,000 |
4, Nunwell Court, Pump Street, Bromyard HR7 4FG
| Today | See what it's worth now |
| 12 Dec 2025 | £85,000 |
| 23 Oct 2008 | £83,000 |
No other historical records.
11, Firs Orchard, Bromyard HR7 4BB
| Today | See what it's worth now |
| 24 Nov 2025 | £282,500 |
| 23 Jul 2010 | £189,950 |
The Woodlands, Stoke Lacy HR7 4RF
| Today | See what it's worth now |
| 21 Nov 2025 | £675,000 |
No other historical records.
58, York Road, Bromyard HR7 4BG
| Today | See what it's worth now |
| 14 Nov 2025 | £260,000 |
| 16 Mar 2000 | £95,000 |
3, Hill View, Bromyard HR7 4AY

| Today | See what it's worth now |
| 14 Nov 2025 | £183,000 |
| 5 May 2004 | £110,000 |
No other historical records.
6, Flaggoners Close, Bromyard HR7 4TZ
| Today | See what it's worth now |
| 6 Nov 2025 | £175,000 |
| 31 May 2019 | £139,000 |
4, Firs Orchard, Bromyard HR7 4BB
| Today | See what it's worth now |
| 31 Oct 2025 | £190,000 |
| 6 Jul 2007 | £163,000 |
No other historical records.
Source Acknowledgement: © Crown copyright. England and Wales house price data is publicly available information produced by the HM Land Registry.This material was last updated on 9 July 2026. It covers the period from 1 January 1995 to 30 April 2026 and contains property transactions which have been registered during that period. Contains HM Land Registry data © Crown copyright and database right 2026. This data is licensed under the Open Government Licence v3.0.
Disclaimer: Rightmove.co.uk provides this HM Land Registry data "as is". The burden for fitness of the data relies completely with the user and is provided for informational purposes only. No warranty, express or implied, is given relating to the accuracy of content of the HM Land Registry data and Rightmove does not accept any liability for error or omission. If you have found an error with the data or need further information please contact HM Land Registry.
Permitted Use: Viewers of this Information are granted permission to access this Crown copyright material and to download it onto electronic, magnetic, optical or similar storage media provided that such activities are for private research, study or in-house use only. Any other use of the material requires the formal written permission of Land Registry which can be requested from us, and is subject to an additional licence and associated charge.
Rightmove takes no liability for your use of, or reliance on, Rightmove's Instant Valuation due to the limitations of our tracking tool listed here. Use of this tool is taken entirely at your own risk. All rights reserved.