
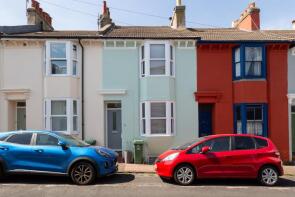
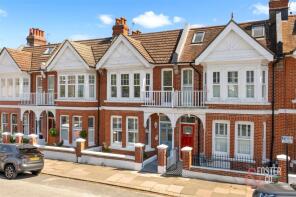
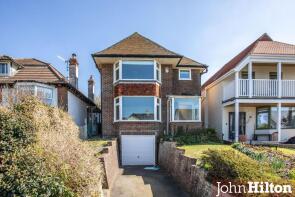
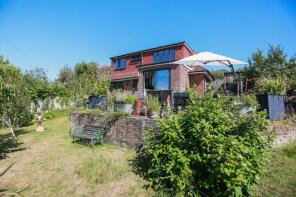
House Prices in Brighton
House prices in Brighton have an overall average of £475,881 over the last year.
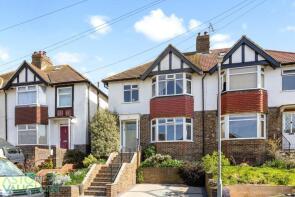
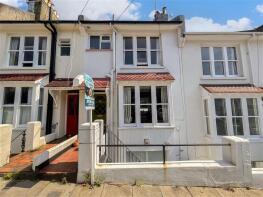
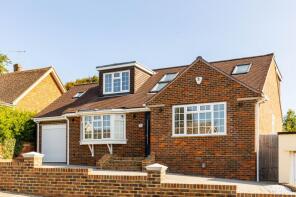
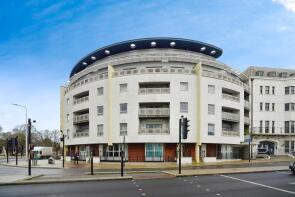
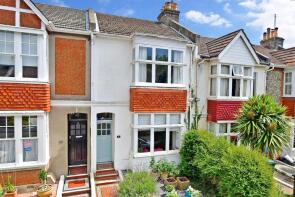
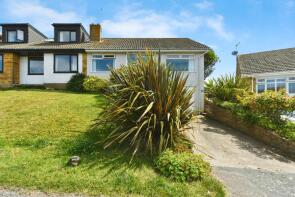
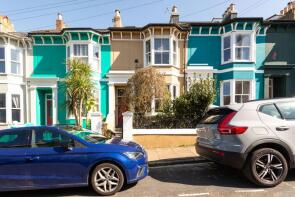
The majority of properties sold in Brighton during the last year were flats, selling for an average price of £299,375. Terraced properties sold for an average of £540,706, with semi-detached properties fetching £531,773.
Properties Sold
43, Upper Abbey Road, Brighton BN2 0AD
| Today | See what it's worth now |
| 26 Mar 2026 | £565,000 |
| 29 Jul 2015 | £510,000 |
25, Highcroft Lodge, Highcroft Villas, Brighton BN1 5PZ
| Today | See what it's worth now |
| 26 Mar 2026 | £327,500 |
| 9 Feb 2015 | £219,000 |
12, Wanderdown Close, Brighton BN2 7BY
| Today | See what it's worth now |
| 23 Mar 2026 | £642,000 |
| 16 Dec 2020 | £565,000 |
18, Campbell Road, Brighton BN1 4QD
| Today | See what it's worth now |
| 20 Mar 2026 | £475,000 |
| 10 Sep 2013 | £370,000 |
7, Ainsworth Close, Brighton BN2 7BH
| Today | See what it's worth now |
| 20 Mar 2026 | £800,000 |
| 21 Sep 2022 | £940,000 |
No other historical records.
28, Reading Road, Brighton BN2 5NE
| Today | See what it's worth now |
| 20 Mar 2026 | £560,000 |
| 11 Nov 2011 | £290,000 |
48, Robertson Road, Brighton BN1 5NJ
| Today | See what it's worth now |
| 20 Mar 2026 | £362,500 |
| 7 Apr 2022 | £330,000 |
Flat 1, 20, Wellington Road, Brighton BN2 3AA
| Today | See what it's worth now |
| 20 Mar 2026 | £200,000 |
| 28 Jun 2005 | £148,000 |
Flat 2a, Bristol Mansions, Sussex Square, Brighton BN2 5AA
| Today | See what it's worth now |
| 20 Mar 2026 | £205,000 |
No other historical records.
2a, Royles Close, Rottingdean, Brighton BN2 7DQ
| Today | See what it's worth now |
| 19 Mar 2026 | £820,000 |
| 29 Oct 2021 | £550,000 |
No other historical records.
6, Quebec Street, Brighton BN2 9UZ
| Today | See what it's worth now |
| 19 Mar 2026 | £497,000 |
| 27 Sep 1996 | £65,500 |
No other historical records.
22, Matlock Road, Brighton BN1 5BF
| Today | See what it's worth now |
| 18 Mar 2026 | £765,000 |
| 3 Oct 2003 | £320,000 |
No other historical records.
18, Newlands Road, Rottingdean, Brighton BN2 7GD
| Today | See what it's worth now |
| 18 Mar 2026 | £775,000 |
| 16 Aug 2002 | £315,000 |
84, Auckland Drive, Brighton BN2 4JG

| Today | See what it's worth now |
| 17 Mar 2026 | £355,000 |
| 14 May 2010 | £202,000 |
35, Cuckmere Way, Brighton BN1 8GA
| Today | See what it's worth now |
| 17 Mar 2026 | £675,000 |
| 13 Apr 2017 | £395,000 |
Flat B, 36, Norfolk Road, Brighton BN1 3AB
| Today | See what it's worth now |
| 17 Mar 2026 | £205,000 |
| 28 Mar 2025 | £210,000 |
268a, Ditchling Road, Brighton BN1 6JF

| Today | See what it's worth now |
| 16 Mar 2026 | £316,000 |
| 27 Nov 2020 | £323,500 |
Flat 9, 80 Royal View, Grand Parade, Brighton BN2 9JA
| Today | See what it's worth now |
| 16 Mar 2026 | £287,000 |
| 22 Dec 2005 | £249,000 |
32, Southdown Avenue, Brighton BN1 6EG
| Today | See what it's worth now |
| 16 Mar 2026 | £660,000 |
| 11 Sep 2009 | £359,000 |
16, Ifield Close, Brighton BN2 8DL
| Today | See what it's worth now |
| 16 Mar 2026 | £425,000 |
| 10 Oct 2014 | £260,000 |
No other historical records.
11, Montreal Road, Brighton BN2 9UY
| Today | See what it's worth now |
| 13 Mar 2026 | £580,000 |
No other historical records.
63, Hollingbury Road, Brighton BN1 7JB
| Today | See what it's worth now |
| 13 Mar 2026 | £500,000 |
| 9 Jul 1999 | £84,950 |
No other historical records.
278, Queens Park Road, Brighton BN2 9ZL
| Today | See what it's worth now |
| 13 Mar 2026 | £460,000 |
| 20 Jul 2020 | £360,000 |
No other historical records.
Source Acknowledgement: © Crown copyright. England and Wales house price data is publicly available information produced by the HM Land Registry.This material was last updated on 15 May 2026. It covers the period from 1 January 1995 to 31 March 2026 and contains property transactions which have been registered during that period. Contains HM Land Registry data © Crown copyright and database right 2026. This data is licensed under the Open Government Licence v3.0.
Disclaimer: Rightmove.co.uk provides this HM Land Registry data "as is". The burden for fitness of the data relies completely with the user and is provided for informational purposes only. No warranty, express or implied, is given relating to the accuracy of content of the HM Land Registry data and Rightmove does not accept any liability for error or omission. If you have found an error with the data or need further information please contact HM Land Registry.
Permitted Use: Viewers of this Information are granted permission to access this Crown copyright material and to download it onto electronic, magnetic, optical or similar storage media provided that such activities are for private research, study or in-house use only. Any other use of the material requires the formal written permission of Land Registry which can be requested from us, and is subject to an additional licence and associated charge.
Map data ©OpenStreetMap contributors.
Rightmove takes no liability for your use of, or reliance on, Rightmove's Instant Valuation due to the limitations of our tracking tool listed here. Use of this tool is taken entirely at your own risk. All rights reserved.