
House Prices in Brockworth
House prices in Brockworth have an overall average of £306,693 over the last year.
The majority of properties sold in Brockworth during the last year were semi-detached properties, selling for an average price of £298,232. Terraced properties sold for an average of £269,853, with detached properties fetching £417,988.
Overall, the historical sold prices in Brockworth over the last year were 5% up on the previous year and 4% down on the 2022 peak of £319,475.
Properties Sold
19, Somerdale Avenue, Brockworth, Gloucester GL3 4WQ
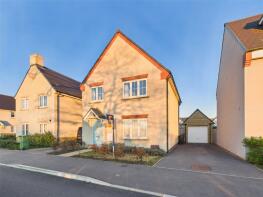
| Today | See today's value |
| 21 Aug 2026 | £402,000 |
| 12 Nov 2021 | £349,000 |
No other historical records.
25, Spinners Road, Brockworth, Gloucester GL3 4LR
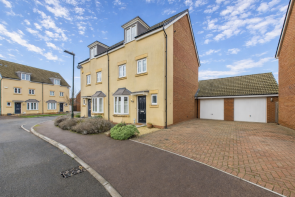
| Today | See today's value |
| 14 Aug 2026 | £405,000 |
| 25 Sep 2015 | £244,995 |
No other historical records.
20, Ridgemount Close, Brockworth, Gloucester GL3 4EJ

| Today | See today's value |
| 10 Aug 2026 | £250,000 |
| 21 Oct 2004 | £140,000 |
No other historical records.
38, Abbotswood Road, Brockworth, Gloucester GL3 4NZ
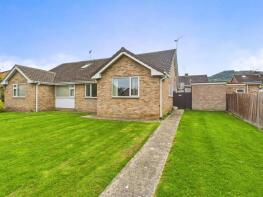
| Today | See today's value |
| 27 Jul 2026 | £260,000 |
| 16 Jun 1998 | £28,500 |
No other historical records.
29, Peregrine Road, Brockworth, Gloucester GL3 4ZE
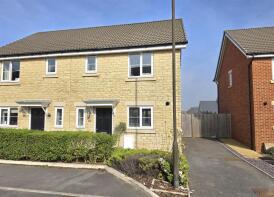
| Today | See today's value |
| 14 Jul 2026 | £312,990 |
| 22 Jun 2018 | £249,995 |
No other historical records.
4, Abbotswood Road, Brockworth, Gloucester GL3 4NZ
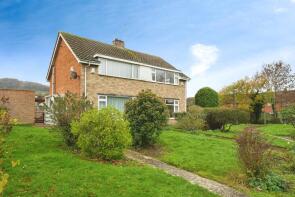
| Today | See today's value |
| 10 Jul 2026 | £268,000 |
| 5 Oct 2001 | £84,750 |
22, Typhoon Way, Gloucester GL3 4DY

| Today | See today's value |
| 9 Jul 2026 | £328,000 |
| 8 Jun 2010 | £170,500 |
No other historical records.
15, Roselle Drive, Brockworth, Gloucester GL3 4GG

| Today | See today's value |
| 8 Jul 2026 | £281,000 |
| 26 Aug 2021 | £240,000 |
12, Hidcote Road, Brockworth, Gloucester GL3 4UW

| Today | See today's value |
| 3 Jul 2026 | £450,000 |
| 23 Dec 2016 | £345,995 |
No other historical records.
5, Daunt Road, Gloucester GL3 4BW
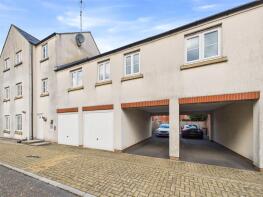
| Today | See today's value |
| 3 Jul 2026 | £180,000 |
| 27 Aug 2021 | £152,000 |
4, Appleby Close, Brockworth, Gloucester GL3 4WT

| Today | See today's value |
| 30 Jun 2026 | £450,000 |
| 9 May 2022 | £431,000 |
No other historical records.
60, Abbotswood Road, Brockworth, Gloucester GL3 4NZ
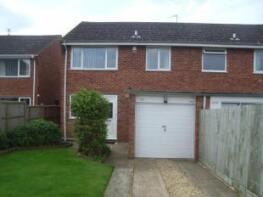
| Today | See today's value |
| 30 Jun 2026 | £290,000 |
| 24 Jun 2005 | £140,000 |
9, Huntsman Drive, Brockworth, Gloucester GL3 4WW
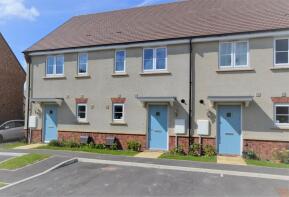
| Today | See today's value |
| 29 Jun 2026 | £225,000 |
| 30 Jan 2023 | £94,000 |
No other historical records.
1, Tanners Close, Brockworth, Gloucester GL3 4QN

| Today | See today's value |
| 26 Jun 2026 | £310,000 |
| 9 Aug 2000 | £89,000 |
No other historical records.
19, Farmhouse Road, Brockworth, Gloucester GL3 4WR

| Today | See today's value |
| 26 Jun 2026 | £405,000 |
| 21 Nov 2022 | £400,000 |
No other historical records.
10, Bluebell Crescent, Brockworth, Gloucester GL3 5AE

| Today | See today's value |
| 22 Jun 2026 | £268,000 |
| 17 Dec 2021 | £274,995 |
No other historical records.
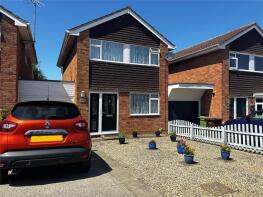
124, Abbotswood Road, Brockworth, Gloucester GL3 4PF
| Today | See today's value |
| 19 Jun 2026 | £292,000 |
No other historical records.
14b, Peregrine Road, Brockworth, Gloucester GL3 4ZE

| Today | See today's value |
| 19 Jun 2026 | £245,000 |
| 19 Dec 2019 | £220,000 |
No other historical records.
21, Chandos Drive, Brockworth, Gloucester GL3 4RG
| Today | See today's value |
| 19 Jun 2026 | £180,000 |
| 23 Jul 2015 | £135,500 |
16, Belgrave House, Whittle Way, Brockworth, Gloucester GL3 4BJ

| Today | See today's value |
| 19 Jun 2026 | £173,500 |
| 14 Jul 2023 | £165,000 |
82, Vicarage Court, Brockworth, Gloucester GL3 4HT

| Today | See today's value |
| 19 Jun 2026 | £135,000 |
| 22 Oct 2022 | £133,500 |
No other historical records.
20, Springmead Avenue, Brockworth, Gloucester GL3 4XU

| Today | See today's value |
| 16 Jun 2026 | £345,000 |
| 19 Nov 2021 | £349,000 |
No other historical records.
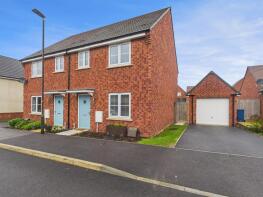
2, Strickland Close, Brockworth, Gloucester GL3 4WX
| Today | See today's value |
| 15 Jun 2026 | £335,000 |
| 19 Dec 2022 | £328,000 |
No other historical records.
Rightmove takes no liability for your use of, or reliance on, Rightmove's Instant Valuation due to the limitations of our tracking tool listed here. Use of this tool is taken entirely at your own risk. All rights reserved.