
House Prices in Bucklawren
House prices in Bucklawren have an overall average of £288,842 over the last year.
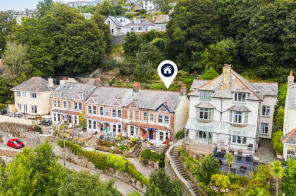
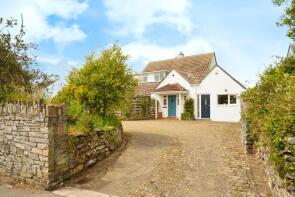
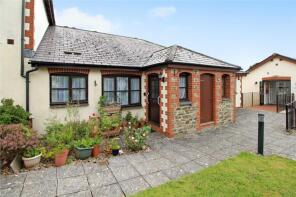
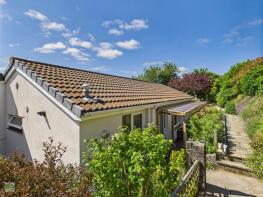
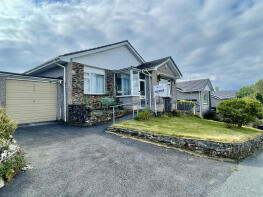
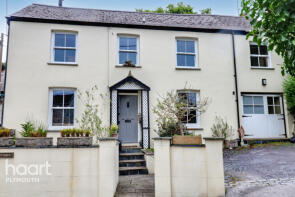
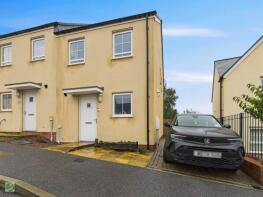
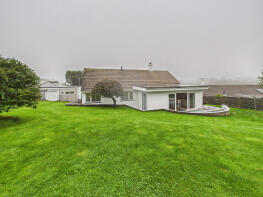
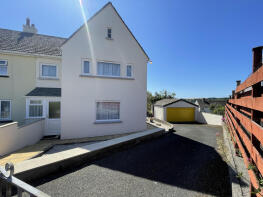
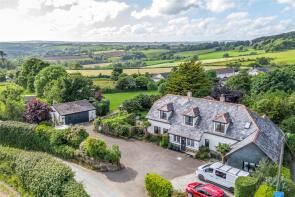
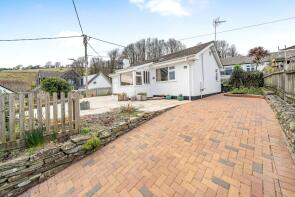
The majority of properties sold in Bucklawren during the last year were detached properties, selling for an average price of £372,250. Terraced properties sold for an average of £241,916, with semi-detached properties fetching £246,750.
Overall, the historical sold prices in Bucklawren over the last year were 5% down on the previous year and 10% down on the 2022 peak of £322,620.
Properties Sold
14, St Winnolls Park, Looe PL13 1DG

| Today | See what it's worth now |
| 18 Mar 2026 | £145,000 |
| 15 Sep 2017 | £290,000 |
1, Hillside Terrace, Shutta Road, Looe PL13 1HS
| Today | See what it's worth now |
| 5 Feb 2026 | £310,000 |
| 28 Feb 2005 | £155,000 |
Eddystone, Barbican Road, Looe PL13 1EU
| Today | See what it's worth now |
| 27 Jan 2026 | £530,000 |
| 1 Oct 2019 | £475,000 |
31, Barbican Court, Barbican Road, Looe PL13 1NT
| Today | See what it's worth now |
| 22 Jan 2026 | £71,000 |
| 23 Nov 2016 | £132,000 |
27, Bodrigan Road, Looe PL13 1EH
| Today | See what it's worth now |
| 7 Jan 2026 | £392,000 |
| 10 Apr 2008 | £256,100 |
1, Blue Horizon, Meadway, East Looe PL13 1JT
| Today | See what it's worth now |
| 19 Dec 2025 | £400,000 |
| 19 Dec 2025 | £400,000 |
No other historical records.
Clare Maris, Meadway, Looe PL13 1JT
| Today | See what it's worth now |
| 16 Dec 2025 | £480,000 |
| 23 Oct 2015 | £292,500 |
No other historical records.
Flat 3 (top Flat), 1, Buller Street, East Looe PL13 1AS
| Today | See what it's worth now |
| 15 Dec 2025 | £45,000 |
| 6 Sep 2007 | £140,000 |
79, Sunrising, Looe PL13 1NE
| Today | See what it's worth now |
| 12 Dec 2025 | £225,000 |
| 18 Mar 2022 | £240,000 |
No other historical records.
2, Barbay, Barbican Road, Looe PL13 1EX
| Today | See what it's worth now |
| 12 Dec 2025 | £200,000 |
| 27 Jun 2011 | £215,000 |
No other historical records.
16, St Winnolls Park, Looe PL13 1DG
| Today | See what it's worth now |
| 11 Dec 2025 | £300,000 |
| 28 Jun 2000 | £105,000 |
Ivy Cottage, Shutta, Looe PL13 1LT
| Today | See what it's worth now |
| 10 Dec 2025 | £385,000 |
| 6 Nov 1998 | £69,950 |
No other historical records.
42, Kimlers Way, St Martin, Looe PL13 1PS
| Today | See what it's worth now |
| 8 Dec 2025 | £239,000 |
| 23 May 2019 | £189,995 |
No other historical records.
20 Lamana, Bodrigan Road, Looe PL13 1EG
| Today | See what it's worth now |
| 28 Nov 2025 | £395,000 |
| 2 Aug 2018 | £243,500 |
No other historical records.
Flat 6, The Old Post Office, Fore Street, Looe PL13 1DT
| Today | See what it's worth now |
| 26 Nov 2025 | £100,000 |
| 2 Nov 2017 | £89,000 |
1, Tremayne Terrace, A387 Between The B3252 And Bake Lane, Looe PL13 1QW
| Today | See what it's worth now |
| 24 Nov 2025 | £215,000 |
| 16 May 2008 | £105,000 |
No other historical records.
1, Springfield Gate, Looe PL13 1HF
| Today | See what it's worth now |
| 12 Nov 2025 | £520,000 |
| 20 Aug 2015 | £490,000 |
6, Bodrigan Road, Looe PL13 1EF
| Today | See what it's worth now |
| 7 Nov 2025 | £305,000 |
| 11 Apr 2005 | £235,000 |
12, Trenant Road, Looe PL13 1EW
| Today | See what it's worth now |
| 6 Nov 2025 | £277,500 |
| 22 Nov 2013 | £165,000 |
2, Harding Meadow, Looe PL13 1QX
| Today | See what it's worth now |
| 4 Nov 2025 | £432,500 |
| 28 Nov 2017 | £270,000 |
5, Trenant Road, Looe PL13 1EN
| Today | See what it's worth now |
| 3 Nov 2025 | £230,000 |
| 7 Jan 2000 | £65,000 |
1, St Winnolls Park, Looe PL13 1DG
| Today | See what it's worth now |
| 27 Oct 2025 | £325,000 |
| 4 Feb 2021 | £285,000 |
83, Sunrising, Looe PL13 1NE
| Today | See what it's worth now |
| 13 Oct 2025 | £265,000 |
No other historical records.
Holland Farm, Bucklawren Road, Nomansland, Looe PL13 1QS
| Today | See what it's worth now |
| 8 Oct 2025 | £701,000 |
| 6 Dec 1996 | £136,000 |
No other historical records.
Brandon, Road From Plaidy Park Road To Plaidy Lane, Kellow, Looe PL13 1LE
| Today | See what it's worth now |
| 6 Oct 2025 | £272,500 |
| 31 Jul 2015 | £245,000 |
No other historical records.
Source Acknowledgement: © Crown copyright. England and Wales house price data is publicly available information produced by the HM Land Registry.This material was last updated on 15 May 2026. It covers the period from 1 January 1995 to 31 March 2026 and contains property transactions which have been registered during that period. Contains HM Land Registry data © Crown copyright and database right 2026. This data is licensed under the Open Government Licence v3.0.
Disclaimer: Rightmove.co.uk provides this HM Land Registry data "as is". The burden for fitness of the data relies completely with the user and is provided for informational purposes only. No warranty, express or implied, is given relating to the accuracy of content of the HM Land Registry data and Rightmove does not accept any liability for error or omission. If you have found an error with the data or need further information please contact HM Land Registry.
Permitted Use: Viewers of this Information are granted permission to access this Crown copyright material and to download it onto electronic, magnetic, optical or similar storage media provided that such activities are for private research, study or in-house use only. Any other use of the material requires the formal written permission of Land Registry which can be requested from us, and is subject to an additional licence and associated charge.
Map data ©OpenStreetMap contributors.
Rightmove takes no liability for your use of, or reliance on, Rightmove's Instant Valuation due to the limitations of our tracking tool listed here. Use of this tool is taken entirely at your own risk. All rights reserved.