
House Prices in Burgess Hill
House prices in Burgess Hill have an overall average of £415,197 over the last year.
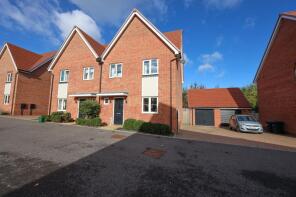
The majority of properties sold in Burgess Hill during the last year were semi-detached properties, selling for an average price of £435,153. Terraced properties sold for an average of £344,883, with detached properties fetching £566,314.
Overall, the historical sold prices in Burgess Hill over the last year were 5% down on the previous year and 1% down on the 2022 peak of £420,814.
Properties Sold
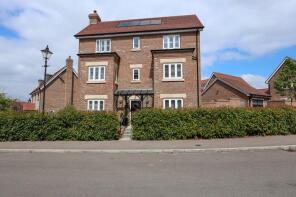
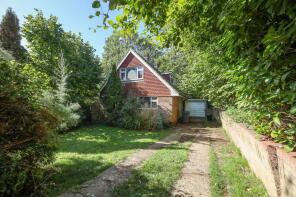
19, Bonnet Lane, Burgess Hill RH15 0FP
| Today | See what it's worth now |
| 23 Apr 2026 | £610,000 |
| 10 Dec 2020 | £539,950 |
No other historical records.
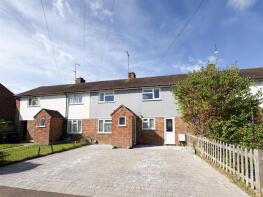
31, Northway, Burgess Hill RH15 0PW
| Today | See what it's worth now |
| 22 Apr 2026 | £340,000 |
| 20 Sep 2022 | £337,500 |
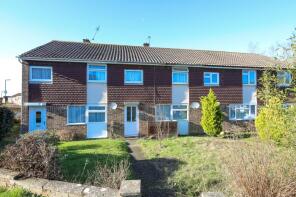
20, Cissbury Road, Burgess Hill RH15 8PN
| Today | See what it's worth now |
| 21 Apr 2026 | £325,000 |
| 22 Jun 2007 | £187,000 |
No other historical records.
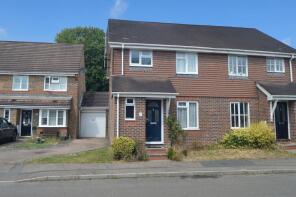
28, Burdocks Drive, Burgess Hill RH15 0HH
| Today | See what it's worth now |
| 15 Apr 2026 | £415,000 |
No other historical records.
61, Burdocks Drive, Burgess Hill RH15 0HJ

| Today | See what it's worth now |
| 15 Apr 2026 | £355,000 |
| 15 Mar 2019 | £292,000 |
62, Coulstock Road, Burgess Hill RH15 9XZ
| Today | See what it's worth now |
| 10 Apr 2026 | £372,500 |
| 30 May 2017 | £327,500 |
22, The Warren, Burgess Hill RH15 0DZ
| Today | See what it's worth now |
| 10 Apr 2026 | £570,000 |
| 6 May 2021 | £473,000 |
2, Hawthorn Close, Burgess Hill RH15 0UH
| Today | See what it's worth now |
| 10 Apr 2026 | £388,000 |
| 8 Feb 2019 | £347,500 |
72, Icarus Avenue, Burgess Hill RH15 0XX
| Today | See what it's worth now |
| 10 Apr 2026 | £255,000 |
| 29 Jun 2021 | £252,000 |
No other historical records.
3, Elizabeth Court, Burgess Hill RH15 9HS
| Today | See what it's worth now |
| 7 Apr 2026 | £280,000 |
| 16 Dec 2019 | £277,000 |
No other historical records.
1, Rolfe Drive, Burgess Hill RH15 0LA
| Today | See what it's worth now |
| 2 Apr 2026 | £605,000 |
| 1 Sep 2016 | £490,000 |
153, Mill Road, Burgess Hill RH15 8DA
| Today | See what it's worth now |
| 2 Apr 2026 | £485,000 |
| 23 Aug 2018 | £365,000 |
32, The Kiln, Burgess Hill RH15 0LU
| Today | See what it's worth now |
| 1 Apr 2026 | £545,000 |
| 15 Dec 2000 | £159,950 |
11, Welbeck Drive, Burgess Hill RH15 0BB
| Today | See what it's worth now |
| 1 Apr 2026 | £625,000 |
| 22 Oct 2021 | £460,000 |
No other historical records.
21, Highlands Drive, Burgess Hill RH15 8JH
| Today | See what it's worth now |
| 1 Apr 2026 | £525,000 |
| 7 Jul 1999 | £149,950 |
No other historical records.
87, Dunstall Avenue, Burgess Hill RH15 8PJ

| Today | See what it's worth now |
| 1 Apr 2026 | £420,000 |
| 27 May 2021 | £375,000 |
28, Malthouse Lane, Burgess Hill RH15 9XA
| Today | See what it's worth now |
| 1 Apr 2026 | £435,000 |
| 24 Sep 1999 | £137,000 |
No other historical records.
12, Baylis Crescent, Burgess Hill RH15 8UP
| Today | See what it's worth now |
| 1 Apr 2026 | £605,000 |
| 9 Nov 2015 | £427,500 |
57, Cants Lane, Burgess Hill RH15 0LT
| Today | See what it's worth now |
| 27 Mar 2026 | £320,000 |
| 16 Mar 2021 | £267,500 |
41, Wolstonbury Court, Burgess Hill RH15 9DP

| Today | See what it's worth now |
| 27 Mar 2026 | £205,000 |
| 6 Jan 2017 | £215,000 |
44, Phoenix Rise, Burgess Hill RH15 0UX
| Today | See what it's worth now |
| 27 Mar 2026 | £432,500 |
| 20 Dec 2016 | £306,950 |
No other historical records.
23, Meeds Road, Burgess Hill RH15 9EB
| Today | See what it's worth now |
| 26 Mar 2026 | £435,000 |
| 30 Oct 2002 | £277,000 |
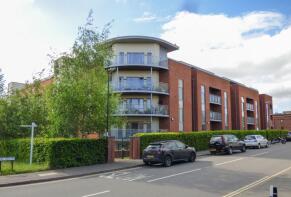
Flat 51, Corbett Court, The Brow, Burgess Hill RH15 9DD
| Today | See what it's worth now |
| 26 Mar 2026 | £240,000 |
| 21 Jun 2023 | £285,000 |
Source Acknowledgement: © Crown copyright. England and Wales house price data is publicly available information produced by the HM Land Registry.This material was last updated on 9 July 2026. It covers the period from 1 January 1995 to 30 April 2026 and contains property transactions which have been registered during that period. Contains HM Land Registry data © Crown copyright and database right 2026. This data is licensed under the Open Government Licence v3.0.
Disclaimer: Rightmove.co.uk provides this HM Land Registry data "as is". The burden for fitness of the data relies completely with the user and is provided for informational purposes only. No warranty, express or implied, is given relating to the accuracy of content of the HM Land Registry data and Rightmove does not accept any liability for error or omission. If you have found an error with the data or need further information please contact HM Land Registry.
Permitted Use: Viewers of this Information are granted permission to access this Crown copyright material and to download it onto electronic, magnetic, optical or similar storage media provided that such activities are for private research, study or in-house use only. Any other use of the material requires the formal written permission of Land Registry which can be requested from us, and is subject to an additional licence and associated charge.
Rightmove takes no liability for your use of, or reliance on, Rightmove's Instant Valuation due to the limitations of our tracking tool listed here. Use of this tool is taken entirely at your own risk. All rights reserved.